
Ruoyu Han, Jiawei Wu, Haibin Zhou, Yongmin Zhang, Aici Qiu, Jiaqi Yan, Weidong Ding, Chen Li, Chenyang Zhang, Jiting Ouyang. Experiments on the characteristics of underwater electrical wire explosions for reservoir stimulation[J]. Matter and Radiation at Extremes, 2020, 5(4): 047201
- Matter and Radiation at Extremes
- Vol. 5, Issue 4, 047201 (2020)
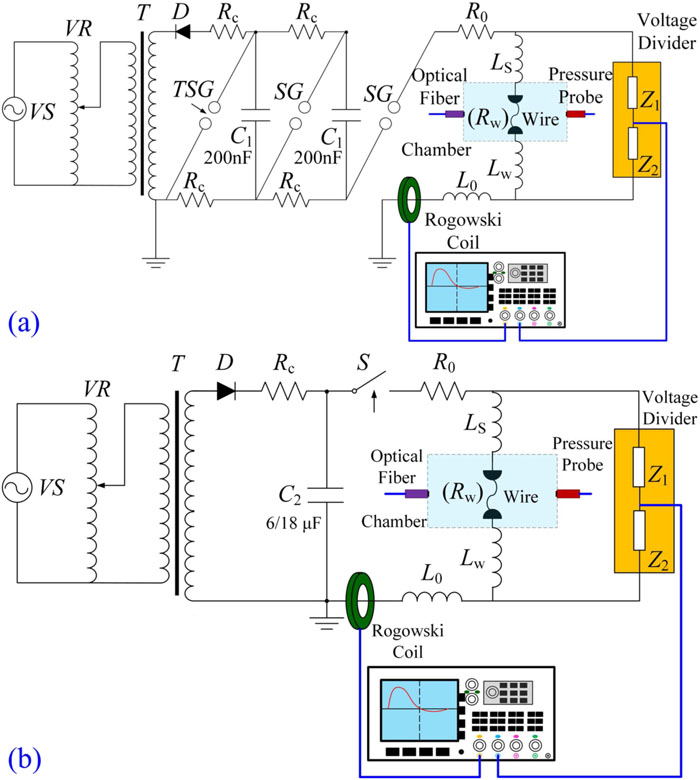
Fig. 1. Schematics of structure of SWE-2 when connected to source (a) 1 and (b) 2 or 3. Reproduced with permission from Han et al. , Rev. Sci. Instrum. 88 , 103504 (2017). Copyright 2017 AIP Publishing LLC.
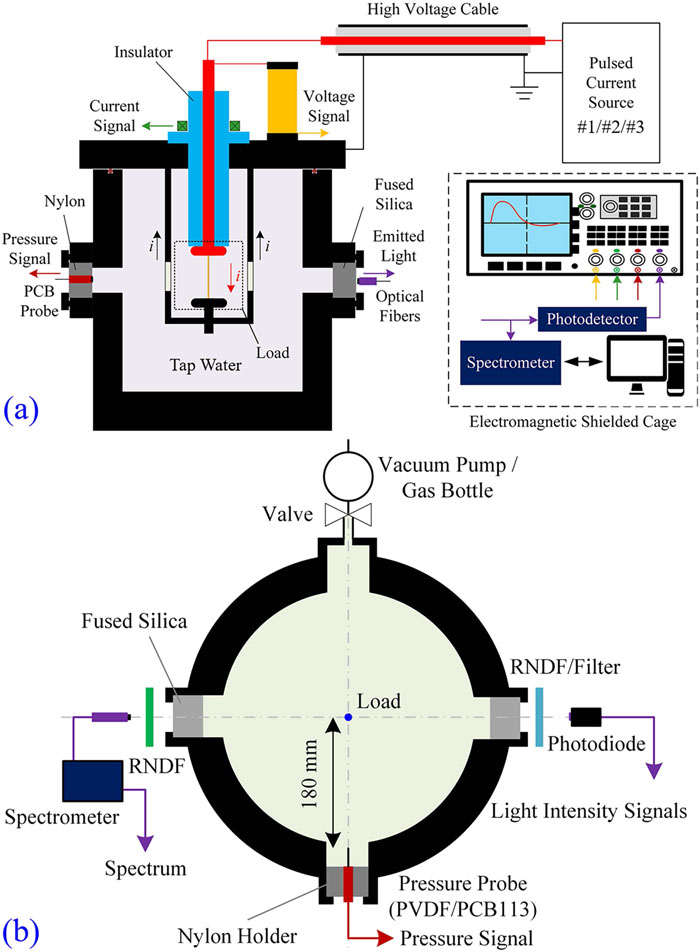
Fig. 2. Schematics of SWE-2: (a) connection of pulsed power source and chamber; (b) arrangement of diagnostic and auxiliary systems. Reproduced with permission from Han et al. , Rev. Sci. Instrum. 88 , 103504 (2017). Copyright 2017 AIP Publishing LLC.
Fig. 3. Three representative discharge types of underwater electrical-wire explosion (UEWE) as represented by the current waveform.
Fig. 4. Discharge parameters and light-intensity waveforms for UEWEs with four sizes of wire (labeled in the figures) under a stored energy of 500 J. Each row [(a) and (b), (c) and (d), (e) and (f), (g) and (h)] depicts the same discharge, but display different timescales of the x-coordinate. Reproduced with permission from Han et al. , J. Appl. Phys. 122 , 033302 (2017). Copyright 2017 AIP Publishing LLC.
Fig. 5. (a) Peak and (b) duration for optical-emission process of Cu and W wire explosions with four sizes under a stored energy of 500 J. Reproduced with permission from Han et al. , J. Appl. Phys. 122 , 033302 (2017). Copyright 2017 AIP Publishing LLC.
Fig. 6. Time-integrated spectra for Cu wire explosions. Reproduced with permission from Han et al. , J. Appl. Phys. 122 , 033302 (2017). Copyright 2017 AIP Publishing LLC.
Fig. 7. Light intensity at five wavelengths in Cu wire explosion with d = (a) 50 µ m, (b) 100 µ m, and (c) 200 µ m. Reproduced with permission from Han et al. , J. Appl. Phys. 122 , 033302 (2017). Copyright 2017 AIP Publishing LLC.
Fig. 8. Pressure waveforms of types (a) and (b) A, (c) B, and (d) C. Reproduced with permission from Han et al. , J. Appl. Phys. 122 , 033302 (2017). Copyright 2017 AIP Publishing LLC.
Fig. 9. Two types of energy-bypass device. Reproduced with permission from Han et al. , Phys. Plasmas 24 , 063511 (2017). Copyright 2017 AIP Publishing LLC.
Fig. 10. Typical (a) and (b) voltage and (c) and (d) current waveforms when water gap or bypass switch acts at different moments. Reproduced with permission from Han et al. , Phys. Plasmas 24 , 063511 (2017). Copyright 2017 AIP Publishing LLC.
Fig. 11. Typical light-intensity waveforms when water gap or bypass switch acts at different moments. Reproduced with permission from Han et al. , Phys. Plasmas 24 , 063511 (2017). Copyright 2017 AIP Publishing LLC.
Fig. 12. Typical pressure waveforms of shock waves (SWs) when water gap or bypass switch acts at different moments. Reproduced with permission from Han et al. , Phys. Plasmas 24 , 063511 (2017). Copyright 2017 AIP Publishing LLC.
Fig. 13. Typical (a) voltage, (b) current, (c) deposition energy, and (d) timings of power, voltage, and resistance peaks for exploding a 300-μ m-diameter, 4-cm-long Cu wire under a stored energy of from 500 J (−12.9 kV) to 2700 J (−30.0 kV). The marks in (c) show the deposited energy at the voltage peak. Reproduced with permission from Han et al. , Phys. Plasmas 24 , 093506 (2017). Copyright 2017 AIP Publishing LLC.
Fig. 14. (a) Deposited energy and (b) energy deposition efficiency vs initial stored energy. Reproduced with permission from Han et al. , Phys. Plasmas 24 , 093506 (2017). Copyright 2017 AIP Publishing LLC.
Fig. 15. Relationships between SW parameters and electrical parameters of UEWE. Reproduced with permission from Han et al. , Phys. Plasmas 24 , 093506 (2017). Copyright 2017 AIP Publishing LLC.
Fig. 16. Relationship between SW parameters and deposition energy in different stages of eight types of UEWE. Reproduced with permission from Han et al. , Phys. Plasmas 24 , 093506 (2017). Copyright 2017 AIP Publishing LLC.
Fig. 17. Typical waveforms and stage division of discharge process. Reproduced with permission from Yao et al. , Phys. Plasmas 26 , 093502 (2017). Copyright 2017 AIP Publishing LLC.
Fig. 18. Voltage, current, and light-intensity waveforms for Al, Cu, Ag, and Au wire explosions with a wire diameter of 200 µ m (a) and (b), with different timescale of x-axis. Reproduced with permission from Han et al. , J. Appl. Phys. 124 , 043302 (2018). Copyright 2018 AIP Publishing LLC.
Fig. 19. Time-integrated spectra of Al, Cu, Ag, and Au explosions with a wire diameter of 200 µ m. Reproduced with permission from Han et al. , J. Appl. Phys. 124 , 043302 (2018). Copyright 2018 AIP Publishing LLC.
Fig. 20. Pressure waveforms of SWs for Al, Cu, Ag, and Au explosions with a wire diameter of 200 µ m. Reproduced with permission from Han et al. , J. Appl. Phys. 124 , 043302 (2018). Copyright 2018 AIP Publishing LLC.
Fig. 21. Voltage, current, and light-intensity waveforms for Mo, Ta, and W explosions with a wire diameter of 200 µ m (a) and (b), with different timescale of x-axis. Reproduced with permission from Han et al. , J. Appl. Phys. 124 , 043302 (2018). Copyright 2018 AIP Publishing LLC.
Fig. 22. Time-integrated spectra of Mo, Ta, and W explosions with a wire diameter of 200 µ m. Reproduced with permission from Han et al. , J. Appl. Phys. 124 , 043302 (2018). Copyright 2018 AIP Publishing LLC.
Fig. 23. Voltage, current, and light-intensity waveforms for Mo, Ta, and W explosions with a wire diameter of 200 µ m (a) and (b), with different timescale of x-axis. Reproduced with permission from Han et al. , J. Appl. Phys. 124 , 043302 (2018). Copyright 2018 AIP Publishing LLC.
Fig. 24. Time-integrated spectra of Ti, Fe, and Pt explosions with a wire diameter of 200 µ m. Reproduced with permission from Han et al. , J. Appl. Phys. 124 , 043302 (2018). Copyright 2018 AIP Publishing LLC.
Fig. 25. Ratio (E 1 + E 2)/E atom for experiments with different wire materials. Reproduced with permission from Han et al. , J. Appl. Phys. 124 , 043302 (2018). Copyright 2018 AIP Publishing LLC.
Fig. 26. Energy (a) deposition process and (b) variation tendency for explosion of a 200-μ m-diameter, 4-cm-long Cu wire in different salt solutions. Reproduced with permission from Han et al. , Eur. Phys. J. Plus 135 , 50 (2020). Copyright 2020 Springer Nature.
Fig. 27. Load voltage U R, circuit current I , deposited energy E W, and load resistance R W waveforms (representative) for exploding a 200-μ m-diameter, 4-cm-long Cu wire under different hydrostatic pressures. Reproduced with permission from Han et al. , Eur. Phys. J. Plus 135 , 50 (2020). Copyright 2020 Springer Nature.
Fig. 28. (a) Structure and real object of an energetic material (EM) load. (b) Schematic of experimental setup with an EM load. Reproduced with permission from Han et al. , J. Appl. Phys. 125 , 153302 (2019). Copyright 2019 AIP Publishing LLC.
Fig. 29. Variations of SW parameters (a) p peak and p peak/Δt rise, (b) t p and J impulse, and (c) E SW and η . EM-1 to EM-6 are filled with NH4NO3, NH4ClO4, and Al powders, and with different dimensions. Reproduced from with permission Han et al. , J. Appl. Phys. 125 , 153302 (2019). Copyright 2019 AIP Publishing LLC.
Fig. 30. (a) Schematics of three generations of underwater SW source proposed by our group. (b) Underwater SWs generated by a water gap (Gen-I), an exploding wire (Gen-II), and an EM load (Gen-III). (c) Power distribution within different frequency domains. Reproduced with permission from Zhou et al. , IEEE Trans. Plasma Sci. 43 , 4017–4023 (2015). Copyright 2015 IEEE.
Fig. 31. Fracturing effects of three types of SW source on coal cube specimens. Reproduced with permission from Zhou et al. , IEEE Trans. Plasma Sci. 43 , 4017–4023 (2015). Copyright 2015 IEEE.
|
Table 1. Summary of discharge parameters for metals in groups 1–3.
|
Table 2. Main conclusions from previous studies and existing problems of UEWE for reservoir-stimulation technology.


Set citation alerts for the article
Please enter your email address

© Copyright 2018-2021 | Chinese Laser Press. All Rights Reserved 沪ICP备15018463号-20