
Fubin Wang, Zhilin Sun. Brightness Characteristics and Fractal Dimension of Spot Ablated by Femtosecond Laser[J]. Laser & Optoelectronics Progress, 2021, 58(24): 2432001
- Laser & Optoelectronics Progress
- Vol. 58, Issue 24, 2432001 (2021)
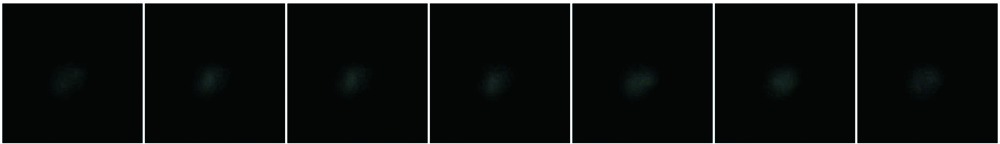
Fig. 1. Spot sequence image
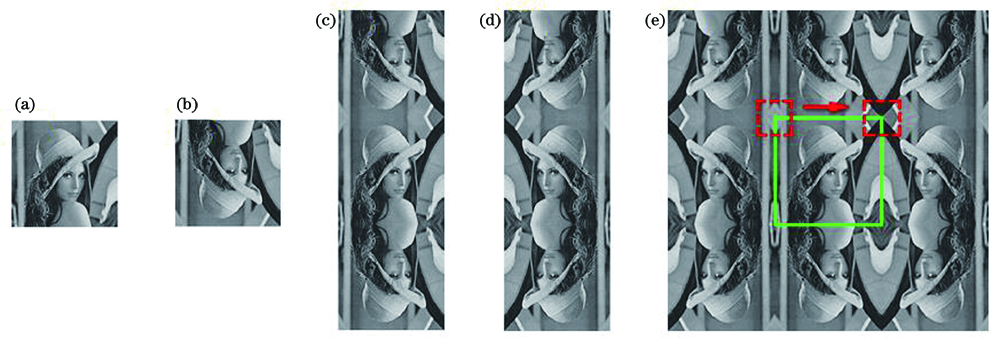
Fig. 2. Reverse order continuation of the image. (a) Original image; (b) arrange the columns of the original image in reverse order; (c) combined image of Fig. 2 (a) and Fig. 2 (b); (d) arrange the rows in Fig. 2 (c) in reverse order; (e) image after extension
Fig. 3. Schematic diagram of the threshold function. (a) Hard threshold function; (b) soft threshold function
Fig. 4. Spot effects obtained by different methods. (a) Original spot image; (b) hard threshold denoising method; (c) soft threshold denoising method; (d) our method
Fig. 5. Segmentation results of K-means clustering method. (a) Preprocessed image; (b) halo and plasma dissipated part; (c) effective area of the spot
Fig. 6. Spot image and gray-scale distribution after processing by different methods. (a) Original spot image; (b) preprocessed image; (c) segmented spot image
Fig. 7. Brightness characteristic change curve of spot sequence images
Fig. 8. Brightness change curves of different ablation intervals. (a) 500--600 frame; (b) 1400--1500 frame
Fig. 9. Brightness change curves extracted by different methods. (a) 500--600 frame; (b) 1400--1500 frame
Fig. 10. Denoising results of different methods. (a) 500--600 frame; (b) 1400--1500 frame
Fig. 11. Processing result of the combination of fractal and multi-scale soft threshold denoising. (a) 500--600 frame; (b) 1400--1500 frame
Fig. 12. Shape of the spot during the movement of the processing platform. (a) Movement process from right to left; (b) spot shape at the far right end; (c) movement process from left to right; (d) spot shape at the far left end
Fig. 13. Analysis of brightness and complexity of different power light spots
|
Table 1. Ablation experimental parameters of silicon microchannels

Set citation alerts for the article
Please enter your email address
© Copyright 2018-2021 | Chinese Laser Press. All Rights Reserved 沪ICP备15018463号-20