• Spectroscopy and Spectral Analysis
  • Vol. 42, Issue 7, 2269 (2022)
Ou RUAN1; 2;, Sui-hua LIU1; 2; *;, Jie LUO1; 2;, and Hai-tao HU1; 2;
Author Affiliations
  • 1. School of Geography and Environmental Science, Guizhou Normal University, Guiyang 550025, China
  • show less
    DOI: 10.3964/j.issn.1000-0593(2022)07-2269-09 Cite this Article
    Ou RUAN, Sui-hua LIU, Jie LUO, Hai-tao HU. Rocky Desertification Information Extraction in Karst Terrain Complex Area Based on Endmember Variable[J]. Spectroscopy and Spectral Analysis, 2022, 42(7): 2269 Copy Citation Text show less
    Location and topographic map of study area
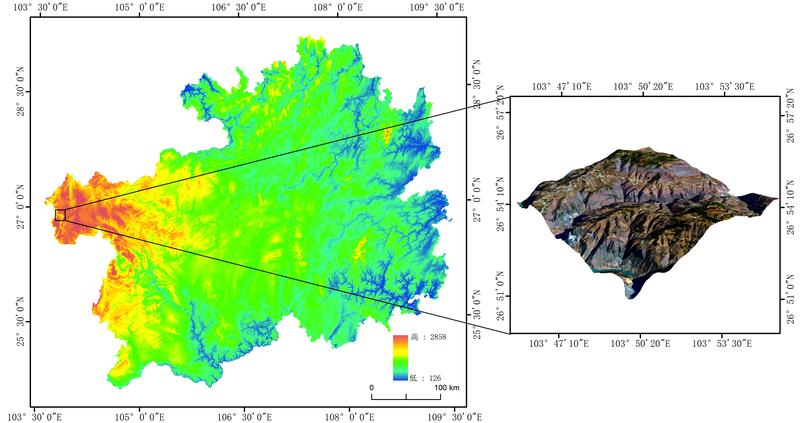
    Fig. 1. Location and topographic map of study area
    Schematic diagram of VCA principle
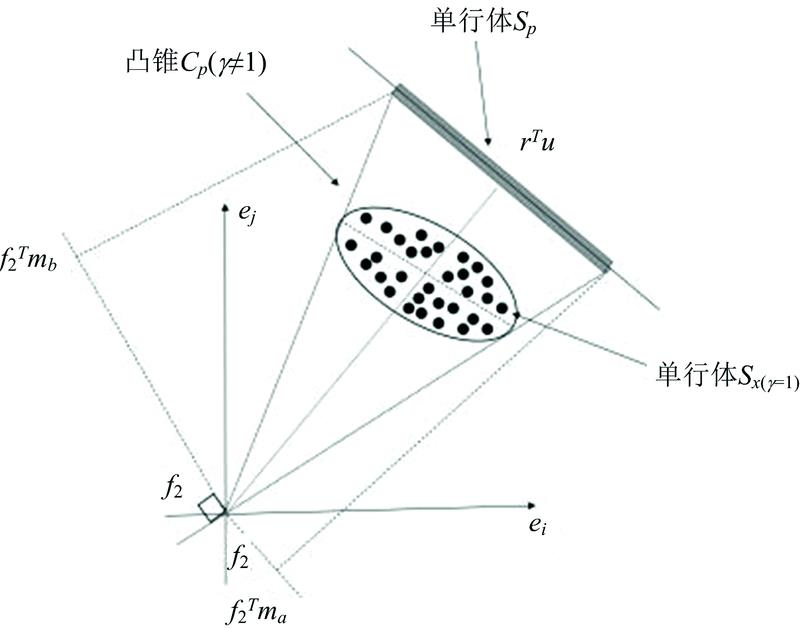
    Fig. 2. Schematic diagram of VCA principle
    Spectral curves of local objects
    Fig. 3. Spectral curves of local objects
    Prediction percentages of bare rock and vegetation coverage in light and shadow areas
    Fig. 4. Prediction percentages of bare rock and vegetation coverage in light and shadow areas
    Comparison of vegetation coverage prediction results of shadow areas with high-definition images by various methods
    Fig. 5. Comparison of vegetation coverage prediction results of shadow areas with high-definition images by various methods
    数据源时间参数获取方式
    GF-22019年1月多光谱4波段, 全色分辨率0.8 m高分贵州分中心
    GF-52020年1月高光谱330波段, 分辨率30 m
    GF-62020年2月多光谱4波段, 全色分辨率2 m
    DEM/分辨率30 m地理空间数据云
    Table 1. Parameters of data source
    光照区阴影区所有区域
    GLMMSCLSUDPMGLMMSCLSUDPMGLMMSCLSUDPM
    OA/%86.8166.5374.4478.1835.9144.0984.8959.6867.34
    Kappa0.7670.4510.5530.5590.1110.0610.7230.3570.433
    Table 2. Overall accuracy (OA) and Kappa coefficient of estimated vegetation and bare rock coverage percentage
    GLMM_光照区
    基岩裸露率/%
    参考数据GLMM_光照区
    植被覆盖度/%
    参考数据
    0~
    20
    20~
    35
    35~
    50
    50~
    70
    70~
    100
    PA/%0~
    20
    20~
    35
    35~
    50
    50~
    70
    70~
    100
    PA/%
    反演
    数据
    0~20290000100.0反演
    数据
    0~2036910078.3
    20~352410057.120~3553650176.6
    35~500262060.035~50012314066.0
    50~70001161550.050~70006341858.6
    70~100000324098.870~100000819396.0
    UA/%93.566.775.076.294.1UA/%87.863.272.173.991.0
    FCLSU_光照区
    基岩裸露率/%
    参考数据FCLSU_光照区
    植被覆盖度/%
    参考数据
    0~
    20
    20~
    35
    35~
    50
    50~
    70
    70~
    100
    PA/%0~
    20
    20~
    35
    35~
    50
    50~
    70
    70~
    100
    PA/%
    反演
    数据
    0~20110000100.0反演
    数据
    0~20312650149.2
    20~351210107.120~35418172043.9
    35~50641009.135~50181416531.8
    50~702147438.950~70246222736.1
    70~1000031325194.070~100311617994.2
    UA/%35.516.712.533.398.4UA/%75.631.632.647.884.4
    DPM_光照区
    基岩裸露率/%
    参考数据DPM_光照区
    植被覆盖度/%
    参考数据
    0~
    20
    20~
    35
    35~
    50
    50~
    70
    70~
    100
    PA/%0~
    20
    20~
    35
    35~
    50
    50~
    70
    70~
    100
    PA/%
    反演
    数据
    0~2016122269.6反演
    数据
    0~2017500077.3
    20~35300010.020~35243851155.1
    35~50620160.035~500142816544.4
    50~701003342.950~700010274234.2
    70~1005361524389.370~100000216498.8
    UA/%51.60.00.014.395.3UA/%41.566.765.158.777.4
    GLMM_阴影区
    基岩裸露率/%
    参考数据GLMM_阴影区
    植被覆盖度/%
    参考数据
    0~
    20
    20~
    35
    35~
    50
    50~
    70
    70~
    100
    PA/%0~
    20
    20~
    35
    35~
    50
    50~
    70
    70~
    100
    PA/%
    反演
    数据
    0~209210075.0反演
    数据
    0~206410054.5
    20~3501000100.020~357210020.0
    35~501011125.035~501040080.0
    50~700012818.250~700009852.9
    70~10000034994.270~10000088991.8
    UA/%90.033.333.333.384.5UA/%42.933.366.752.991.8
    FCLSU_阴影区
    基岩裸露率/%
    参考数据FCLSU_阴影区
    植被覆盖度/%
    参考数据
    0~
    20
    20~
    35
    35~
    50
    50~
    70
    70~
    100
    PA/%0~
    20
    20~
    35
    35~
    50
    50~
    70
    70~
    100
    PA/%
    反演
    数据
    0~2020000100.00反演
    数据
    0~209631145.0
    20~35101000.0020~3540111260.0
    35~5000000/35~500013392.3
    50~70631000.0050~701012247.1
    70~10010165887.8870~10000007100.0
    UA/%20.000.000.000.00100.00UA/%64.30.016.711.87.2
    DPM_阴影区
    基岩裸露率/%
    参考数据DPM_阴影区
    植被覆盖度/%
    参考数据
    0~
    20
    20~
    35
    35~
    50
    50~
    70
    70~
    100
    PA/%0~
    20
    20~
    35
    35~
    50
    50~
    70
    70~
    100
    PA/%
    反演
    数据
    0~20000010.0反演
    数据
    0~202210040.0
    20~35000110.020~35402520.0
    35~500011127.135~5010221311.1
    50~7050042611.450~7000121411.8
    70~10053201864.370~10074086878.2
    UA/%0.00.033.366.731.0UA/%14.30.033.311.870.1
    Table 3. Confusion matrix of accuracy verification of results in illumination area and shadow area
    GLMM_裸岩GLMM_植被FCLSU_裸岩FCLSU_植被DPM_裸岩DPM_植被
    相关系数-0.1590.0450-0.621**-0.582**0.549**
    p0.2690.7580.998000
    Table 4. Correlation coefficient between prediction value of each method and cosine value of solar incident angle
    Ou RUAN, Sui-hua LIU, Jie LUO, Hai-tao HU. Rocky Desertification Information Extraction in Karst Terrain Complex Area Based on Endmember Variable[J]. Spectroscopy and Spectral Analysis, 2022, 42(7): 2269
    Download Citation