
Álvaro Morales, Idelfonso Tafur Monroy, Fredrik Nordwall, Tommi Sørensen. 50 GHz optical true time delay beamforming in hybrid optical/mm-wave access networks with multi-core optical fiber distribution[J]. Chinese Optics Letters, 2018, 16(4): 040603
- Chinese Optics Letters
- Vol. 16, Issue 4, 040603 (2018)
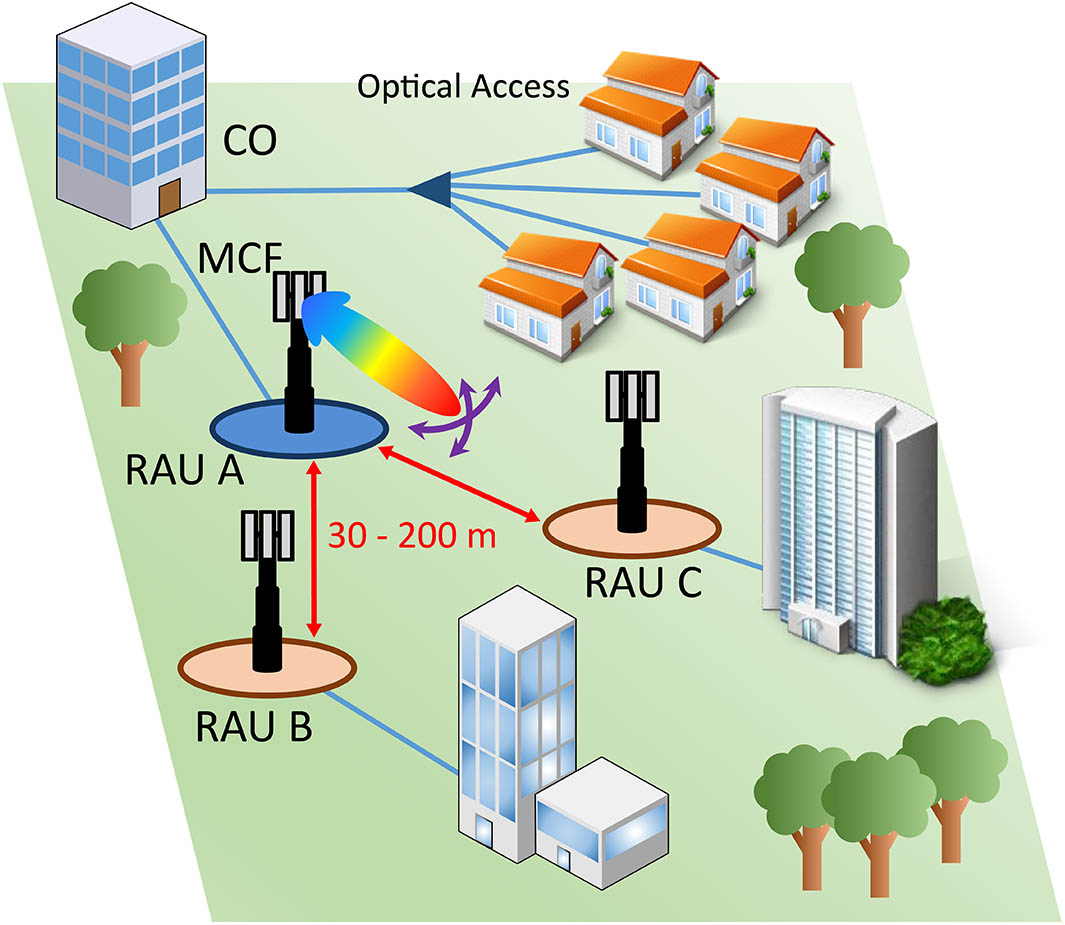
Fig. 1. Hybrid optical/mm-wave access network with beamforming capabilities. CO, central office; MCF, multi-core fiber; RAU, radio access unit.
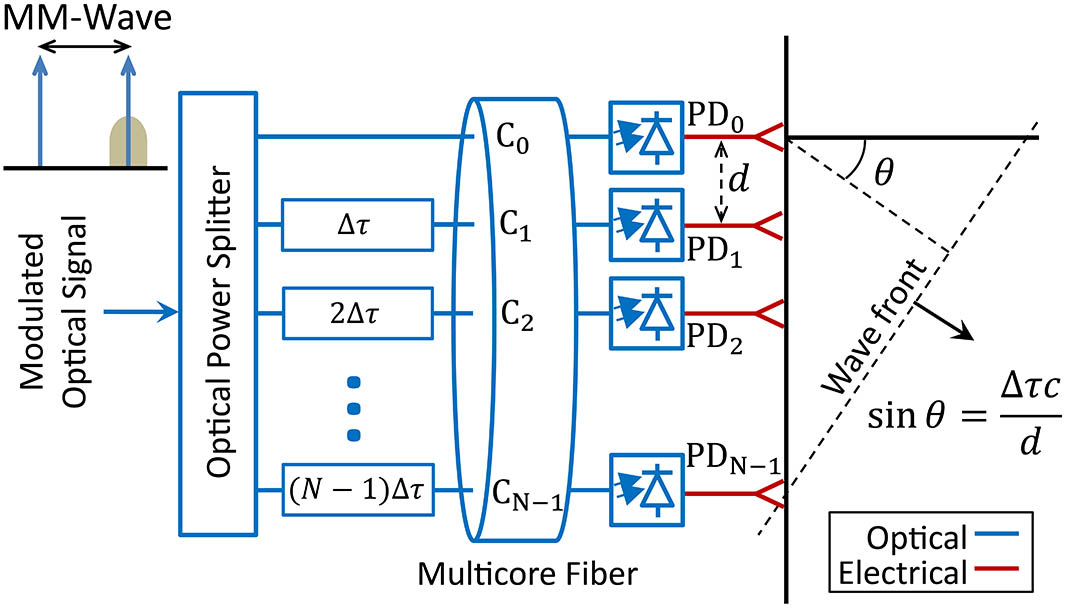
Fig. 2. Principle of optical true time delay beamforming in a linear phased antenna array.
Fig. 3. Experimental setup. CO, central office; RAU, radio access unit; CW, continuous wave; PC, polarization controller; VSG, vector signal generator; RF, radio frequency; MZM, Mach–Zehnder modulator; EDFA, erbium-doped fiber amplifier; AWG, arbitrary waveform generator; NRZ, non-return-to-zero; VOA, variable optical attenuator; OTDL, optical time delay line; MCF, multi-core fiber; PD, photodiode. (a) Beamformer network. (b) PD array. (c) Captured signals.
Fig. 4. Experimental demonstration of proposed OTTD beamforming scheme in four scenarios: Δ τ = − 1 / 4 f c Δ τ = 0 Δ τ = 1 / 4 f c Δ τ = 1 / 2 f c
Fig. 5. Delay variation with time in four scenarios: Δ τ = − 1 / 4 f c τ = 0 Δ τ = 1 / 4 f c Δ τ = 1 / 2 f c
Fig. 6. Eye diagrams of demodulated signals.
|
Table 1. Measured Insertion Loss and Cross-talk at 1550 nm for the Seven-core Fiber
|
Table 2. Measured Results of Delay Between Two Channels

Set citation alerts for the article
Please enter your email address
© Copyright 2018-2021 | Chinese Laser Press. All Rights Reserved 沪ICP备15018463号-20