
Lingling Guo, Qichang Zhao, Yong Yang, Shaolin Wang, Rui Shu. Method for Suppression of Impulse Noise in Spaceborne Fourier Transform Infrared Spectrometer[J]. Acta Optica Sinica, 2020, 40(8): 0830003
- Acta Optica Sinica
- Vol. 40, Issue 8, 0830003 (2020)
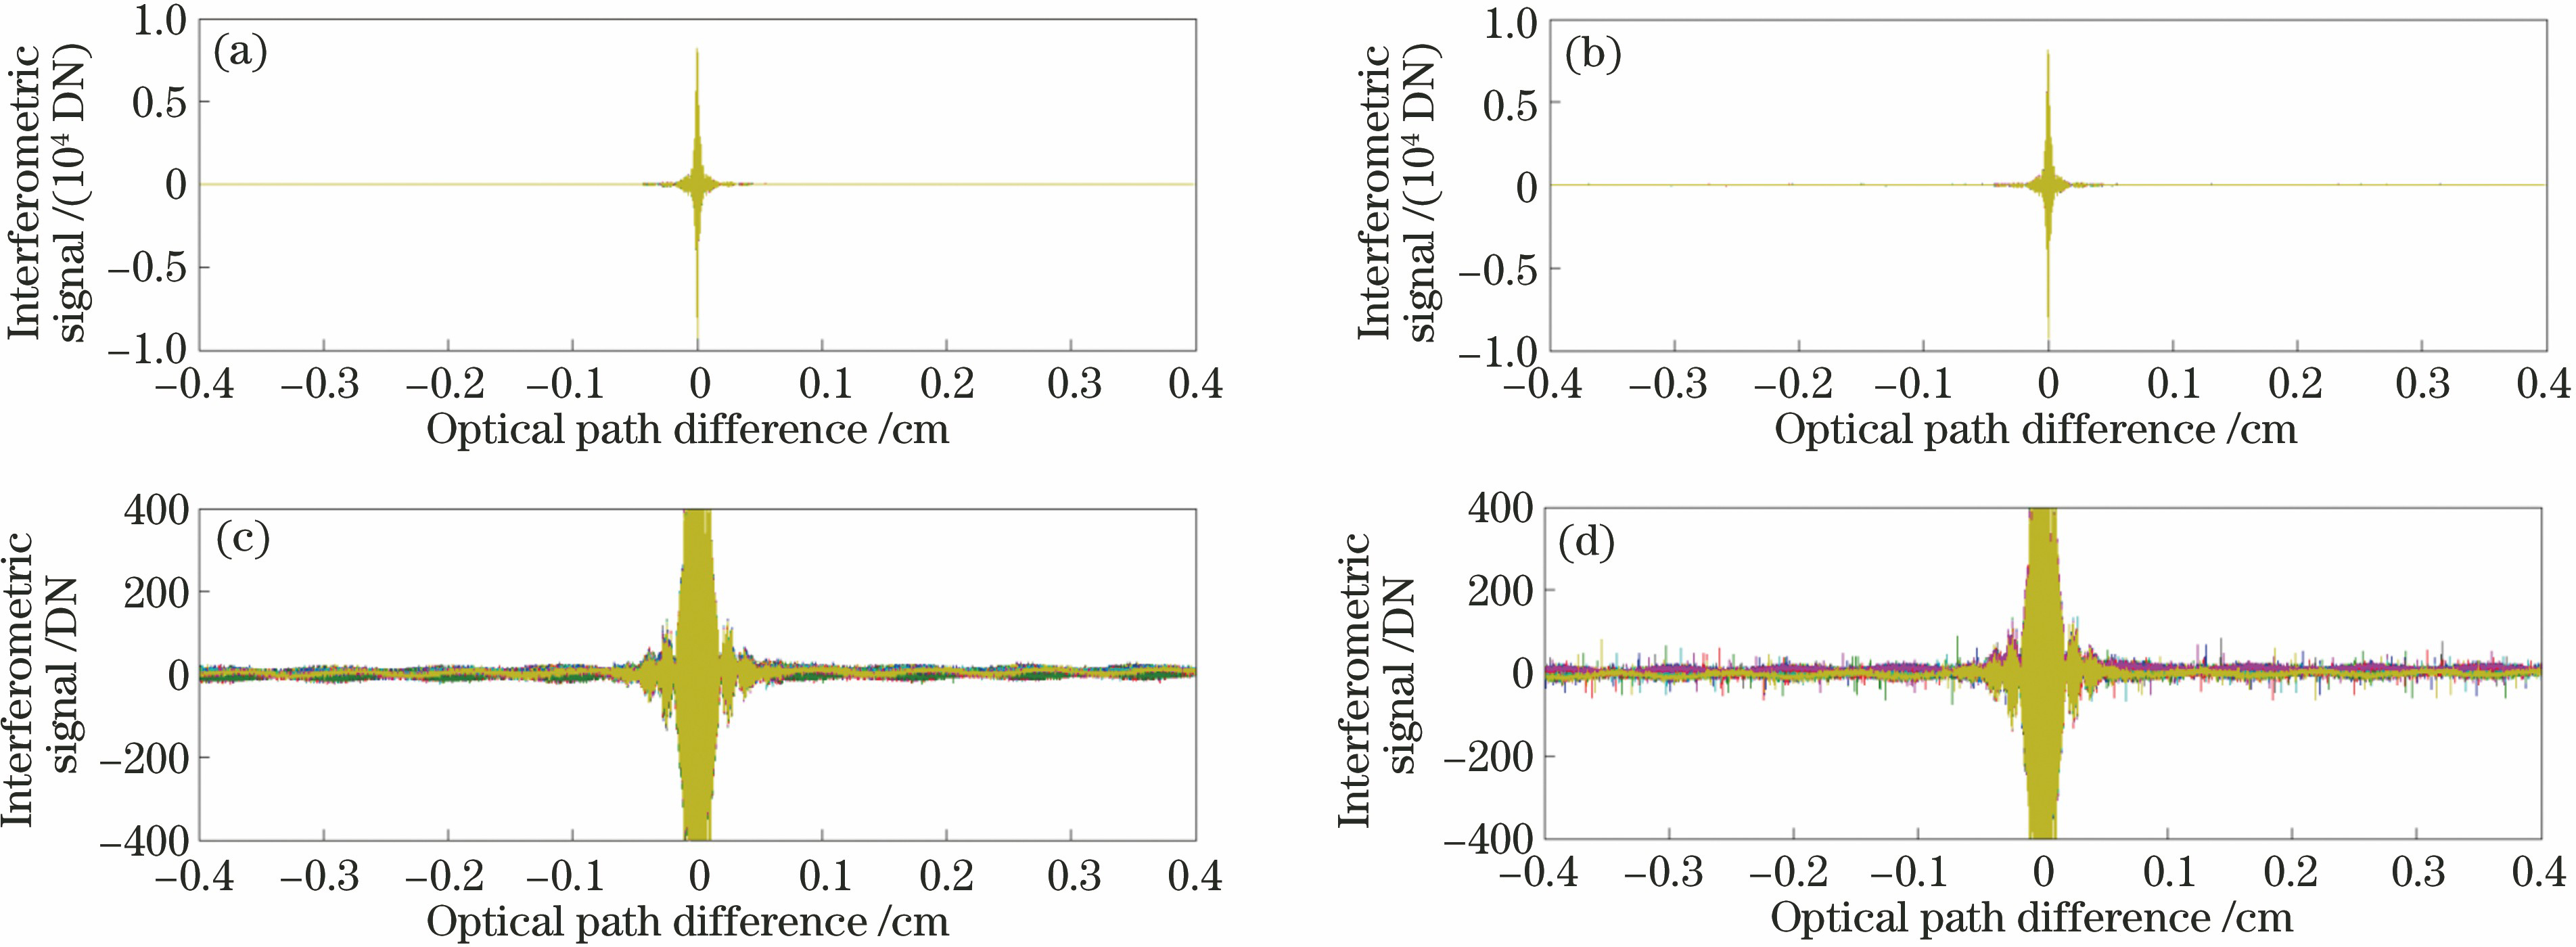
Fig. 1. Interferograms with impulse noise. (a) Interferogram recorded when the drive circuit of scanning motor is disabled; (b) interferogram recorded when the drive circuit of scanning motor is enabled; (c) stretched display corresponding to Fig. 1 (a); (d) stretched display corresponding to Fig. 1 (b)
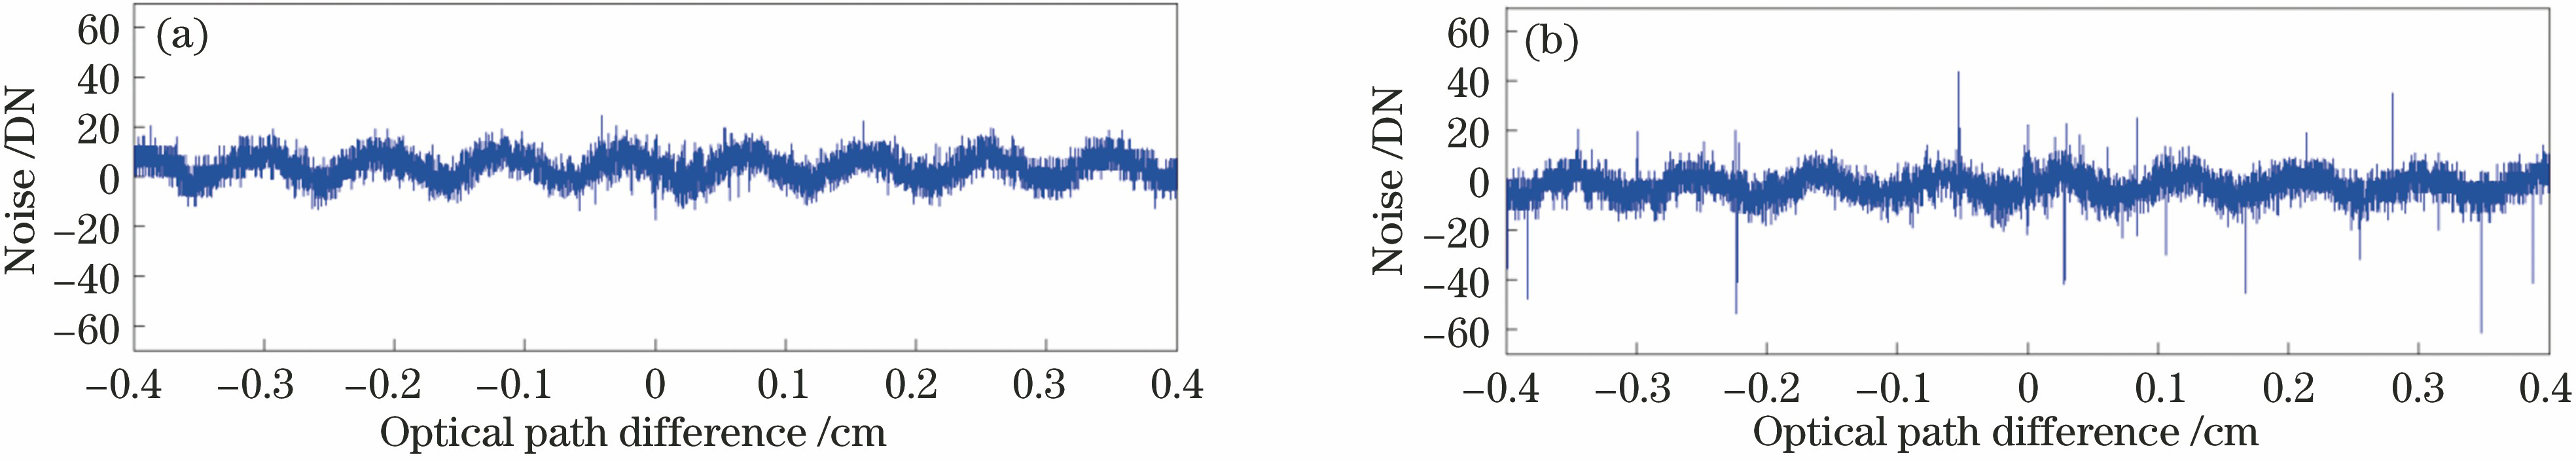
Fig. 2. Noise of interferograms. (a) When the drive circuit of scanning motor is disabled; (b) when the drive circuit of scanning motor is enabled
Fig. 3. Noise of interferograms after the low-frequency fixed noise is filtered. (a) When the drive circuit of scanning motor is disabled; (b) when the drive circuit of scanning motor is enabled
Fig. 4. Noise histograms of interferograms without impulse noise
Fig. 5. Noise histograms of interferograms with impulse noise
Fig. 6. Comparison of standard deviationin uncalibrated spectra
Fig. 7. Frequency spectra of low-frequency fixed noise and Gaussian noise
Fig. 8. Predefined mask of interferogram
Fig. 9. Result of different impulse noise suppressing methods
Fig. 10. Spectral relative deviation of different impulse noise suppressing methods
Fig. 11. Results of impulse noise suppression. (a) Amax=30, R=0.01; (b) Amax =60, R=0.01; (c) Amax =60, R=0.1; (d) Amax =60, R=0.05
Fig. 12. Interferogram comparison before and after impulse noise suppression
Fig. 13. NEdN comparison before and after impulse noise suppression
|
Table 1. Comparison of relative deviation after impulse noise suppression

Set citation alerts for the article
Please enter your email address
© Copyright 2018-2021 | Chinese Laser Press. All Rights Reserved 沪ICP备15018463号-20