• Laser & Optoelectronics Progress
  • Vol. 55, Issue 5, 053002 (2018)
Meiyi Li, Fei Wang*, and Yaqi Zhang
Author Affiliations
  • State Key Laboratory of Clean Energy Utilization, College of Energy Engineering, Zhejiang University, Hangzhou, Zhejiang 310027, China
  • show less
    DOI: 10.3788/LOP55.053002 Cite this Article Set citation alerts
    Meiyi Li, Fei Wang, Yaqi Zhang. Measurement of Nitric Oxide with Low Concentration Based on Mid-Infrared Laser Absorption Spectroscopy[J]. Laser & Optoelectronics Progress, 2018, 55(5): 053002 Copy Citation Text show less
    Absorption line strengths of NO, CO, H2O, and CO2 with wavelength from 1 μm to 6 μm at 600 K
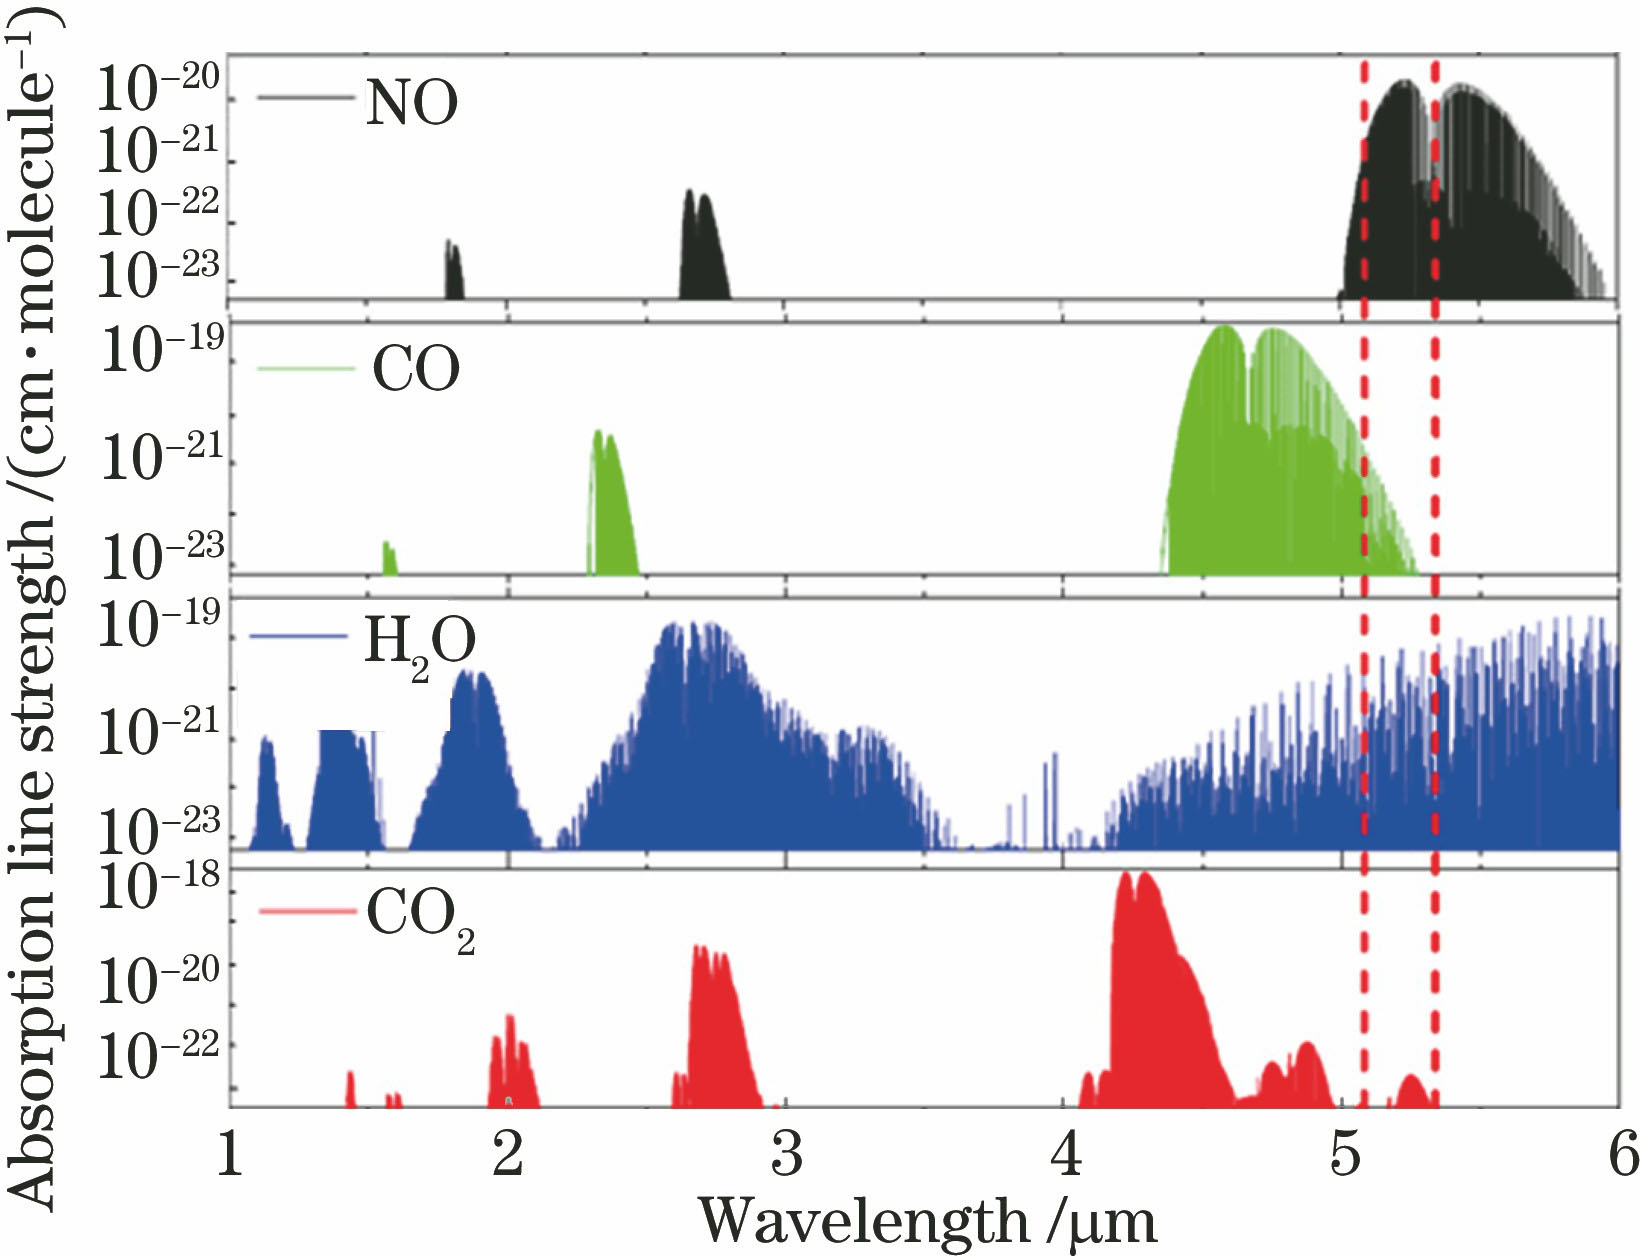
    Fig. 1. Absorption line strengths of NO, CO, H2O, and CO2 with wavelength from 1 μm to 6 μm at 600 K
    Absorption line strengths of NO and H2O with wavenumber from 1900 cm-1 to 1940 cm-1 at different temperatures. (a) 296 K; (b) 600 K; (d) 1000 K
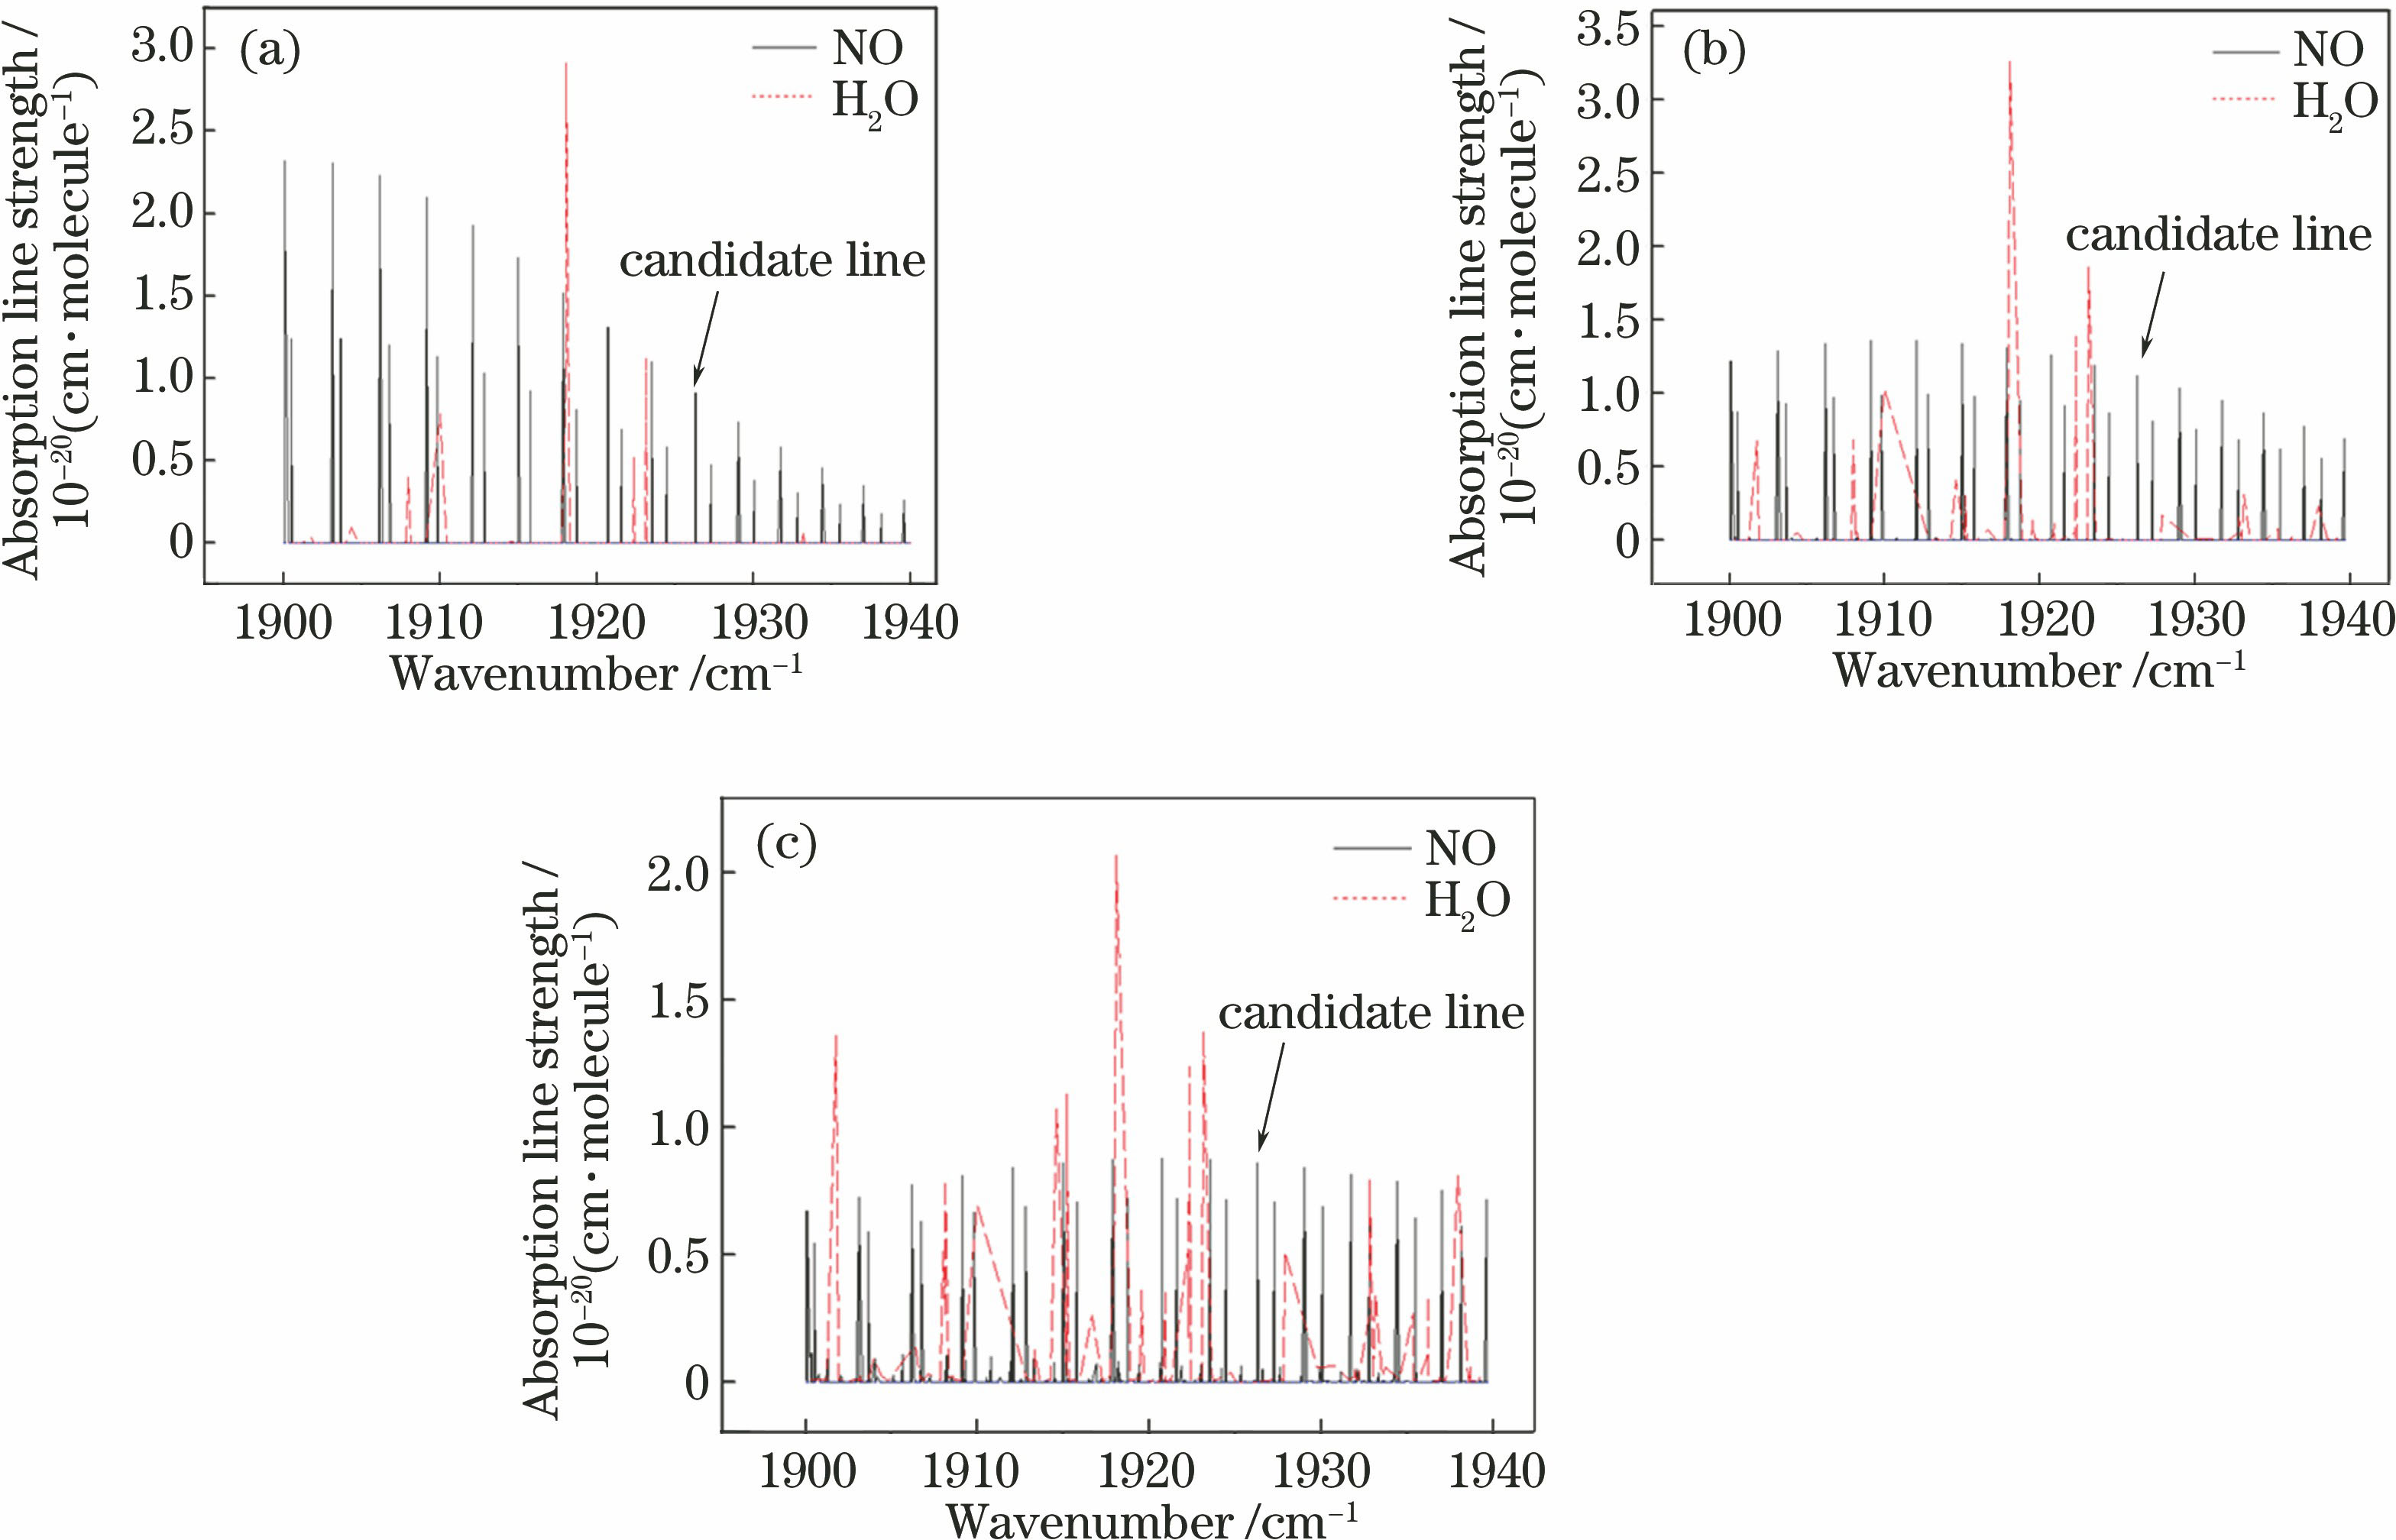
    Fig. 2. Absorption line strengths of NO and H2O with wavenumber from 1900 cm-1 to 1940 cm-1 at different temperatures. (a) 296 K; (b) 600 K; (d) 1000 K
    Diagram of measurement system
    Fig. 3. Diagram of measurement system
    Variation of second harmonic signal-to-noise ratio with modulation current when the volume fraction of NO is 0.46×10⁻⁴
    Fig. 4. Variation of second harmonic signal-to-noise ratio with modulation current when the volume fraction of NO is 0.46×10⁻⁴
    Linear correlation coefficient of second harmonic peak and NO concentration with modulation current of 3-25 mA
    Fig. 5. Linear correlation coefficient of second harmonic peak and NO concentration with modulation current of 3-25 mA
    Modulationcurrent /mAVolume fraction of NO/10-4
    0.460.711.001.31
    37.838.258.528.37
    58.898.709.5310.49
    812.4412.7513.4812.76
    1113.5312.7314.4013.62
    1510.2210.3711.679.59
    179.288.399.3310.26
    208.429.618.117.39
    256.347.685.407.43
    Table 1. Signal-to-noise ratio of second harmonic signal with different modulation currentsdB
    Given volumefraction ofNO /10-6Measured volumefraction ofNO /10-6RelativedeviationSignal-to-noise ratio
    65.2897-0.1189.82
    89.06810.1339.55
    1111.7130.06510.96
    1312.846-0.01210.95
    1716.625-0.02210.80
    2020.4030.02011.60
    Table 2. Measured concentration of NO, relative deviation, and signal-to-noise ratio of second harmonic signal at room temperature
    Given volumefraction ofNO /10-6Measured volumefraction ofNO /10-6RelativedeviationSignal-to-noise ratio
    1111.5600.05110.83
    1312.713-0.02210.93
    1716.822-0.01010.91
    2020.6760.03410.96
    Table 3. Measured concentration of NO, relative deviation, and signal-to-noise ratio of second harmonic signal at 600 K
    Meiyi Li, Fei Wang, Yaqi Zhang. Measurement of Nitric Oxide with Low Concentration Based on Mid-Infrared Laser Absorption Spectroscopy[J]. Laser & Optoelectronics Progress, 2018, 55(5): 053002
    Download Citation