
Yuchen Ren, Xiaoxue Hu, Min Huang, Yu Liu, Xiu Li. Influence of Laser Post-Treatment on Spectral Properties of Structural Color Coatings with Different Substrates[J]. Acta Optica Sinica, 2023, 43(13): 1314002
- Acta Optica Sinica
- Vol. 43, Issue 13, 1314002 (2023)
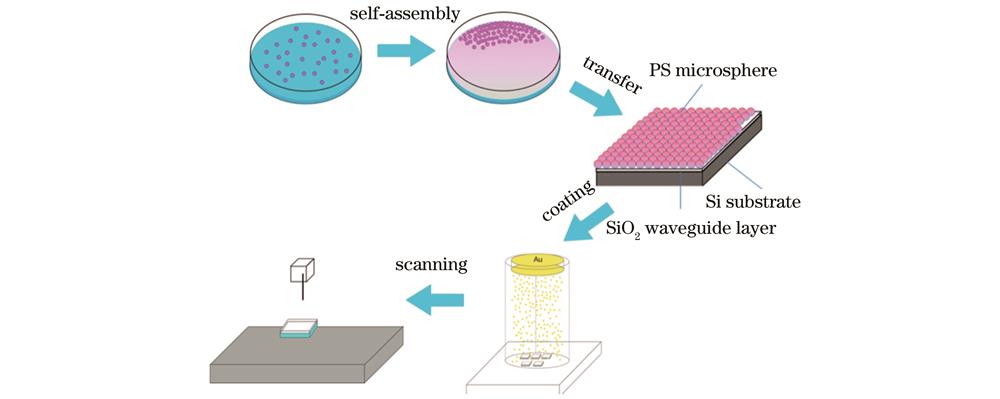
Fig. 1. Schematic of fabrication process for structural color samples by laser post-treatment

Fig. 2. Principles of coloration by Si/ SiO2/PS composite structure
Fig. 3. Schematic of multilayer film interference
Fig. 4. Reflection spectra of samples changing with coating time and laser scanning speed.(a) 20 s;(b) 80 s;(c) 120 s
Fig. 5. Chromaticity coordinates of samples at different coating times and laser scanning speeds
Fig. 6. Influence of coating time and scanning speed on spectral reflection of samples.(a) 50 mm/s; (b) 200 mm/s
Fig. 7. Microtopography of samples. (a) 20 s 50 mm/s; (b) 20 s 200 mm/s; (c) 80 s 50 mm/s; (d) 80 s 200 mm/s; (e) 120 s 50 mm/s; (f) 120 s 200 mm; cross section image (g) 80 s 30 mm/s, (h) 80 s 80 mm/s, (i) 80 s 140 mm/s
Fig. 8. Spectral reflection curve and chromaticity coordinate diagram of samples before and after adding SiO2 layer. (a) Spectral reflection curve; (b) chromaticity coordinate diagram
Fig. 9. SEM images of samples before and after adding SiO2 layer at different scanning speeds. (a) Si substrate 80 s 50 mm/s; (b) SiO2 substrate 80 s 50 mm/s; (c) Si substrate 80 s 200 mm/s; (d) SiO2 substrate 80 s 200 mm/s
|
Table 1. Theoretical wavelength values at different incident angles when the particle size is 500 nm
| ||||||||||||||||||||
Table 2. Reflection peak position at different incidence angles when the particle size is 500 nm

Set citation alerts for the article
Please enter your email address
© Copyright 2018-2021 | Chinese Laser Press. All Rights Reserved 沪ICP备15018463号-20