State Key Laboratory of Precision Measurement Technology and Instruments, Center for Photonics and Electronics, Department of Precision Instruments, Tsinghua University, Beijing 100084, China
Dongxian Geng, Xing Fu, Pengfei Du, Wei Wang, Mali Gong, "Combination of differential discrimination and direct discrimination in pulsed laser time-of-flight systems," Chin. Opt. Lett. 14, 062801 (2016)
Copy Citation Text
The output amplitude of the differential circuit is studied for differential discrimination in pulsed laser time-of-flight systems. Based on the studies of the probability of detection and the probability of false alarms, the minimum detectable input signal of differential discrimination can be calculated. The results indicate that the differential discrimination detectability of the small signal will be reduced. A combined discrimination is proposed in this Letter to improve the time resolution of the large signal and ensure the probability of detection of the small signal at the same time. A proper value of the circuit parameter is found to balance the time resolutions of the small and large signals.
Pulsed laser time-of-flight (TOF) measurement has been studied since the 1960s[1,2]. Compared with the amplitude continuous wave (AMCW) TOF system, the pulsed laser TOF system has a wider measurement range and a better capacity of resisting disturbance, such as atmospheric turbulence[3]. Moreover, since the pulsed laser TOF system is much simpler and more reliable, it is widely used in laser rangefinder, LIDAR, and three-dimensional sensing[4–6]. In order to deal with the multiple returns, which are always caused by some semitransparent object or two objects in tandem[7–10], higher time resolution is needed in these systems because it is more difficult to distinguish two pulses if the two echo laser pulses are closer. For the classical direct discriminator with a fixed threshold that is used in most pulsed laser TOF systems, the time resolution decreases rapidly with the increase in the amplitude of the input signal. With the development of the laser, the full width at half-maximum (FWHM) of a laser has been reduced to subnanosecond or picosecond[11]. However, for these kind of lasers, high power is difficult to be realized. On the other hand, the time resolution is also limited by the response speed of the photodetector. So, when the FWHM of the laser is given, some solutions have been developed to distinguish two pulses when two echo laser pulses are close. Based on the data acquired by a high-speed sampler, some stochastic simulation algorithms have been used to recognize two overlapped pulses[12–14]. This approach can distinguish two laser pulses when they are very close, but it is a time-consuming task and, because the sampling speed needs to be very high, the system will be more complex.
Another way to improve the time resolution is to use a differential discriminator instead of the classical discriminator[15]. The time resolution of a differential discriminator decreases little with the increase in the amplitude of the input signal, but the relationship between the time resolution and the input amplitude is not monotonic. If the input amplitude is small, the time resolution will decrease rapidly with the decrease in the amplitude of input signal. Moreover, the previous work indicated that the amplitude of the output signal will be reduced by the differential discriminator. So, the amplitude of the minimum detectable signal will be influenced when the probability of detection is given.
The research in this Letter is based on the differential discrimination technique. The main goal of the research is finding a way to improve the time resolution as well as ensure the detection probability of the small signal. First, the amplitude of the output signal has been simulated. The relationship between the amplitude of the input signal () and the amplitude of the output signal () of the differential circuit has been obtained. Then, electrical circuit experiments have been done and the simulations have been verified. On the other hand, the probability of detection and the probability of false alarms have been studied. Based on these studies and the input/output amplitude relationship, the amplitude of the differential discrimination of the minimum detectable input signal can be calculated. The minimum detectable input signal of the differential discriminator is calculated to be larger than that of the classical direct discriminator. In order to improve the time resolution and at the same time ensure the detection probability of the small signal, a combination of the classical direct discriminator and the differential discriminator has been proposed and, according to the calculated minimum detectable input signal, an optimized (the time constant of the differential circuit) has been obtained to balance the time resolutions of the small large signals. Simulations and experiments have been done. The time resolution of the large signal has been improved significantly, and the probability of detection of the small signal can be ensured at the same time.
Sign up for Chinese Optics Letters TOC. Get the latest issue of Chinese Optics Letters delivered right to you!Sign up now
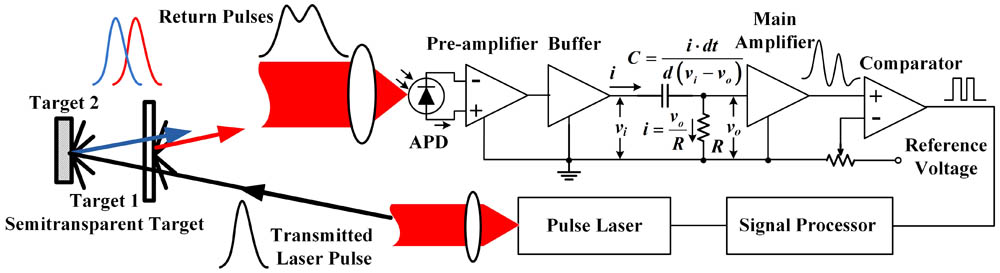
The basic circuit of the differential discriminator is shown in Fig. 1. Here, the response model of a single returned laser pulse is written approximatelyas a Gaussian function[16], so the input of the differential circuit is where is the input voltage of the differential circuit, is the amplitude of the Gaussian pulse, is the time position of the center of the peak, and controls the width of the pulse. The FWHM of a Gaussian laser pulse is
The relationship between the input and the output of the differential circuit in Fig. 1 is
Equation (3) is an ordinary differential equation (ODE). In Eq. (3), is the time constant of the differential circuit and , is the resistance of the differential circuit, and is the capacitance of the differential circuit. For the purpose of finding the minimum detectable input signal of the differential discriminator, the of the differential circuit in Fig. 1 has to be calculated. Here, Eq. (1) is brought into Eq. (3) to get the output of the differential,
It is difficult to solve for the theoretical value of Eq. (4), so numerical calculations to solve the ODEs has been applied. Here, the output signal of a Gaussian input pulse is calculated by the ODE45 function in MATLAB.
Experiments have been done to verify the simulations. The Gaussian signal was generated by a function generator (Agilent 81150A). Limited by the generator, the FWHM of the pulse is set to 46.6 ns, which means . Previous work indicated that the effect of the differential circuit has no relationship to the absolute pulse width. The effect is only dependent upon the ratio of and [15]. The amplitude of the input signal is set to 1 V and is set to (). In the simulation, the time ranges from 0 to 200 ns with 2000 sampling points. The discrete time step length is 0.1 ns. The simulated and experimental results are shown in Fig. 2. The solid lines are the experimental results and the dashed lines are the simulated results. In order to make the figure more readable, a time deviation between the simulated and experimental results is intentionally added.
Figure 2.Input signal and output signal of the differential circuit. and .
Simulations and experiments with different values of have been done to find the relationship between the and the value of . The results are illustrated in Fig. 3. The dashed lines are the simulation results and the triangles are the experimental results. The red lines and triangles are the results for which the is 1 V, and the black lines and triangles are the results for which the is 2 V.
In order to find the relationship between and , different amplitudes of the input signal were set in other simulations and experiments, where the values of are set to 1.4 (, ) and 7.0 (, ). The results are illustrated in Fig. 4.
Figure 4.Relationship between and of the differential circuit.
The results indicate that the simulations fit the experimental values very well and that is proportional to . That means the red dashed line in Fig. 3 can illustrate the relationship between the value of and the value of . So, if the values of and are given, can be obtained from this relationship curve, which can be written as
For the discriminator with a comparator, the minimum amplitude of the detectable signal is dependent on the given minimum probability of detection , the root mean square (RMS) voltage value of the noise, and the threshold voltage . For the incoherent detection system, the probability of detection in the Gaussian noise can be written as where is the Gaussian error function. For most applications, the threshold is dependent on the RMS voltage value of the noise and the given maximum probability of false alarms . The probability of a false alarm in the Gaussian noise is given by where is the complementary function of the Gaussian error function. The threshold can be calculated by Eq. (7). Then, for a classical direct discrimination, the minimum amplitude of the detectable signal can be calculated according to Eq. (6) when the maximum probability of detection is given. Combining Eqs. (6) and (7), can be written as where is the inverse error function and is the inverse complementary error function. On the other hand, the differential circuit can be used as a high pass filter, reducing the noise a little. So, the RMS voltage values of the input and output noise are approximately equal. The amplitude of the minimum detectable output signal of the differential circuit () can also be calculated according to Eqs. (5) and (6). Based on Eq. (5) and the relationship curve in Fig. 3, the amplitude of the minimum detectable input signal () can be obtained. According to Eqs. (8) and (5), can be written as
For example, if the RMS voltage value of the noise is about 2 mV and the probability of false alarms needs to be lower than 0.01%, the threshold of either discriminator is 7.438 mV, calculated by Eq. (7). In order to set the threshold easily, the magnification of the main amplifier in Fig. 1 is set to 20 dB, so the threshold should then be 74.38 mV. And, according to Eq. (6), the minimum detectable signal of the classical discriminator is about 10 mV for a 90% (0.9) probability of detection. For the differential discriminator, if is 1.0, the minimum detectable signal is about 19 mV. If is 7.0, the minimum detectable signal of the differential discriminator is about 83 mV, which means that if the amplitude of the signal is lower than 83 mV the detectable probability will be lower than 0.9 when , and for the 10 mV input signal, the detectable probability of the differential discriminator is almost equal to zero.
The time resolution has been simulated to show the relationship between the time resolution and the input amplitude. The results are shown in Fig. 5. The horizontal axis is the input amplitude before the main amplifier. The magnification of the main amplifier is 20 dB. The vertical axis is the minimum time interval for which two pulses can be exactly distinguished. In Fig. 5, a lower time interval means a higher time resolution. The simulations indicated that the time resolution of the differential discrimination will be higher than that of the classical direct discrimination, especially when the return signals are large. However, the time resolution decreases with the amplitude when the signal is small; the reason has been analyzed in previous work[15]. On the other hand, the differential discrimination has a better time resolution with a larger , especially when the input signals are large, but the range of the detectable small signal decreases as increases.
Figure 5.Simulated relationship between the time resolution and the return pulse amplitude.
The combination of differential discrimination and classical direct discrimination is a way to solve these disadvantages of the two kinds of discriminations.
Here, two discriminators are used at the same time, as shown in Fig. 6. Classical direct discrimination is used to estimate whether there is a pulse and enables the differential discriminator to improve the time resolution. For example, if the classical discriminator outputs a digital pulse, the number of pulses is recorded as one. This digital pulse is used as a signal to enable the differential discriminator. Then, if the pulse number of the differential discriminator is more than one, the final result uses the differential discriminator’s output. Otherwise, the final result uses the classical discriminator’s output.
In order to verify the decision scheme mentioned above, simulations have been done and the results are shown in Fig. 7. As in the simulations in Fig. 5, of the Gaussian pulse in Fig. 7 is set to and the threshold is set to 74.38 mV. is 1.0 in Fig. 7(a), and 7.0 in Fig. 7(b). In Fig. 7, the red dashed lines illustrate the simulation results of the combined discriminator that is based on the decision scheme.
Figure 7.Simulations for the combined discrimination.
However, the combination of two discriminators shows a better performance in time resolution when the signal is small. For example in Fig. 7(a), although the signal amplitude is between 19 and 23 mV it can be detected by the differential discriminator and the time resolution of the differential discrimination is still lower than that of the classical discrimination. So, using the classical direct discriminator can reach a higher time resolution when the amplitude of the input signal is lower than 23 mV, and the combination based on the decision scheme mentioned above can achieve that automatically without finding the threshold voltage used to enable the classical direct discriminator.
Figure 7(b) shows the combined discrimination when . Compared with the scenario in Fig. 7(a), the time resolution of the combined discrimination is higher when the input signal is large. However, if the signal is smaller than 83 mV, the time resolution decreases rapidly to compensate. So, the value of is dependent on the demand of the application.
In this Letter, in order to balance the time resolution of both the small signal and large signal, an optimized value of has been calculated based on Eq. (9) and the simulation of the time resolution. The optimized result is shown in Fig. 8(a). The step length of in the simulation is 0.01. When , the minimum detectable signal of the differential discriminator is 25 mV and the time resolution of the differential discriminator equals the time resolution of the classical discriminator at this input amplitude.
Figure 8.Simulations and experiments for the combined discrimination with an optimized .
Experiments have been presented, and the block is displayed in Fig. 6. Gaussian pulses were also generated by the dual channel pulse function generator (Agilent 81150A). In the experiments, the amplitudes of the return pulse ranges from 10 to 500 mV, and the FWHM of the pulse is set to 46.6 ns, which means that . Channel 2 generated a delayed pulse that was the same as channel 1. The time interval between two pulses can be adjusted manually. The logical scheme of the combined discriminator is realized by the field programmable gate array (FPGA). In order for the experiments to correspond with the simulation in Fig. 8(a) as much as possible, the resistance is set to 91 Ω and the capacitance is 200 pF. The corresponding simulation with has also been presented in Fig. 8(a) for comparison. The experimental results are shown in Fig. 8(b). The time interval for which two pulses can be distinguished exactly was recorded as the time resolution. The error between the experimental results and the simulated results can be derived from the error of the threshold, the parasitic capacitance, and the speed of the comparator.
In this Letter, the relationship between the input amplitude and the output amplitude of the differential discrimination is studied. Through simulations, the relationship between and in the differential circuit is obtained. On the other hand, the probability of detection and the probability of false alarms are studied. Based on these studies, the minimum detectable input signal of the differential circuit can be calculated. For the purpose of increasing the time resolution of the large signal as well as ensuring the detectability of the small signal, the combination of differential discrimination and classical direct discrimination is proposed. Finally, a proper value of is simulated to balance the time resolution of the small and large signal. The experimental results indicate that this combined discrimination can improve the time resolution of large signals significantly and ensure the time resolution and probability detection of the small signal at the same time.
References
[1] B. S. Goldstein, G. F. Dalrymple. Proc. IEEE, 55, 181(1967).
Dongxian Geng, Xing Fu, Pengfei Du, Wei Wang, Mali Gong, "Combination of differential discrimination and direct discrimination in pulsed laser time-of-flight systems," Chin. Opt. Lett. 14, 062801 (2016)