
Peng Wang, Rui Liu, Xuejing Xin, Peidong Liu. Scene Classification of Optical Remote Sensing Images Based on Residual Networks[J]. Laser & Optoelectronics Progress, 2021, 58(2): 0210001
- Laser & Optoelectronics Progress
- Vol. 58, Issue 2, 0210001 (2021)
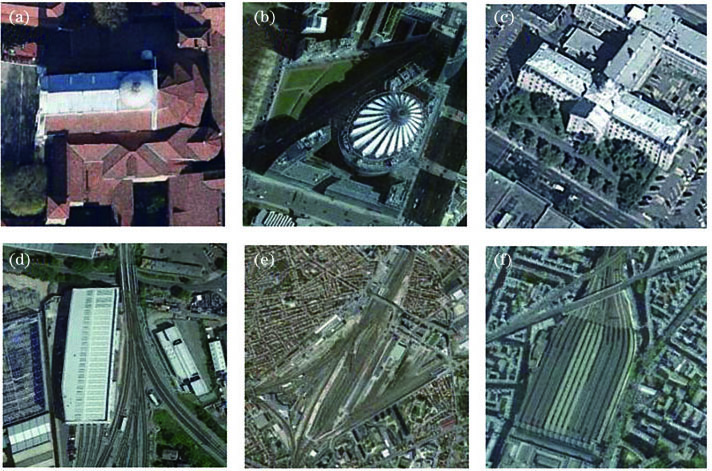
Fig. 1. In-class diversity. (a) (b) (c) Church category; (d) (e) (f) railway station category
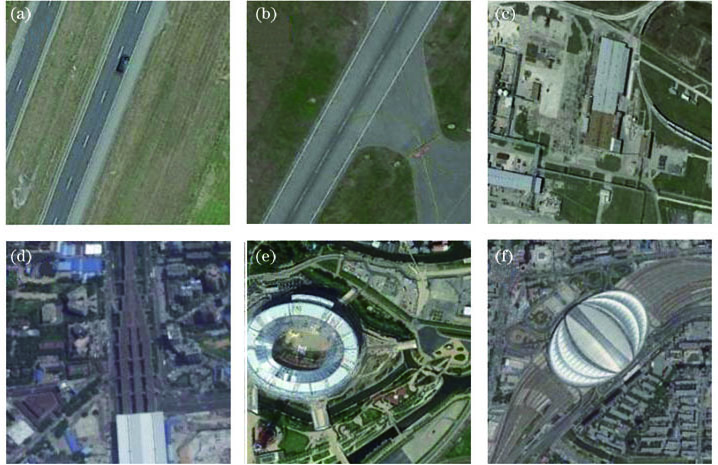
Fig. 2. Between-class similarity. (a) (b) freeway versus runway; (c) (d) industrial area versus railway station; (e) (f) stadium versus train station
Fig. 3. Shortcut connection of resnet
Fig. 4. Network structure diagram
Fig. 5. Graphic example of jump connection
Fig. 6. UC Merced Land Use remote sensing image dataset. (a) Beach; (b) baseball field; (c) overpass
Fig. 7. Google of SIRI-WHU sensing image dataset. (a) River; (b) pond; (c) harbor
Fig. 8. NWPU-RESISC45 sensing image dataset. (a) Forest; (b) circular farmland; (c) river
Fig. 9. UC Merced Land Use data set classification results
Fig. 10. Google of SIRI-WHU data set classification results
Fig. 11. NWPU-RESISC45 data set classification results
|
Table 1. Introduction of experimental environment
|
Table 2. Comparison of the classification results obtained for the UC Merced Land Use dataset unit: %
|
Table 3. Comparison of the classification results obtained for the Google of SIRI-WHU dataset unit: %
|
Table 4. Comparison of the classification results obtained for the NWPU-RESISC45 dataset unit: %

Set citation alerts for the article
Please enter your email address
© Copyright 2018-2021 | Chinese Laser Press. All Rights Reserved 沪ICP备15018463号-20