• Journal of Natural Resources
  • Vol. 35, Issue 6, 1484 (2020)
Zheng-chao REN1、2、*, Hua-zhong ZHU3, Hua SHI4, and Xiao-ni LIU5
Author Affiliations
  • 1College of Finance and Economics, Gansu Agricultural University, Lanzhou 730070, China
  • 2Research Center of Ecological Construction and Environmental Conservation in Gansu Province, Lanzhou 730070, China
  • 3Institute of Geographical Sciences and Natural Resources Research, CAS, Beijing 100101, China
  • 4Earth Resources Observation and Science (EROS) Center, ASRC Federal InuTeq, Contractor to the U.S. Geological Survey (USGS), Sioux Falls 57198, USA
  • 5College of Pratacultural Science, Gansu Agricultural University, Lanzhou 730070, China
  • show less
    DOI: 10.31497/zrzyxb.20200619 Cite this Article
    Zheng-chao REN, Hua-zhong ZHU, Hua SHI, Xiao-ni LIU. Spatio-temporal distribution pattern of potential natural vegetation and its response to climate change from Last Interglacial to future 2070s in China[J]. Journal of Natural Resources, 2020, 35(6): 1484 Copy Citation Text show less
    Spatial distribution pattern and its variation of super-classes for potential natural vegetation from Last Interglacial to future 2070s in China
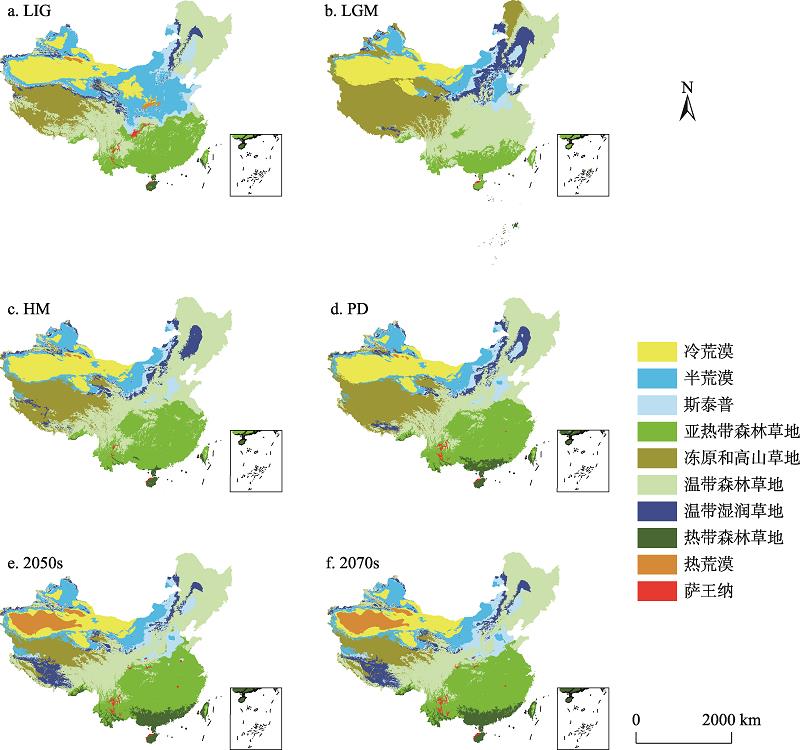
    Fig. 1. Spatial distribution pattern and its variation of super-classes for potential natural vegetation from Last Interglacial to future 2070s in China
    Spatio-temporal pattern evolution of super-classes for potential natural vegetation from Last Interglacial to future 2070s in China
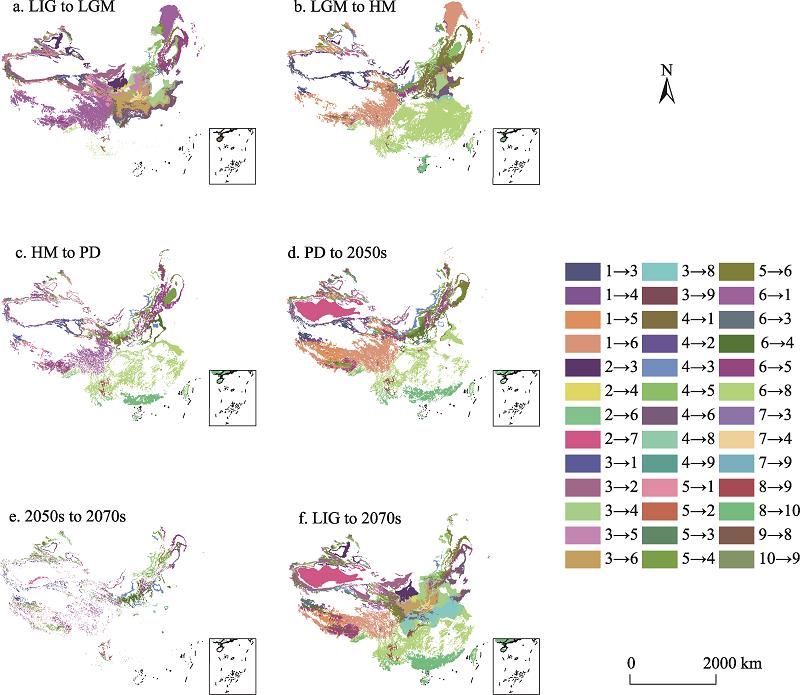
    Fig. 2. Spatio-temporal pattern evolution of super-classes for potential natural vegetation from Last Interglacial to future 2070s in China
    Spatio-temporal distribution pattern of annual accumulated temperature ≥0 ℃ (Σθ) and humidity (K) from Last Interglacial to future 2070s in China
    Fig. 3. Spatio-temporal distribution pattern of annual accumulated temperature ≥0 ℃ (Σθ) and humidity (K) from Last Interglacial to future 2070s in China
    Comparison of spatial distribution of super-classes for potential natural vegetation coming from two different data sources during Present-Day in China
    Fig. 4. Comparison of spatial distribution of super-classes for potential natural vegetation coming from two different data sources during Present-Day in China
    Geometrical center, shifting distance and direction of super-classes for potential natural vegetation during different periods in China
    Fig. 5. Geometrical center, shifting distance and direction of super-classes for potential natural vegetation during different periods in China
    k一致性程度
    0~0.05极差
    0.05~0.20非常差
    0.20~0.40
    0.40~0.55一般
    0.55~0.70
    0.70~0.85非常好
    0.85~0.99优秀
    0.99~1.00极好
    Table 1. Degree of agreement represented by Kappa statistics
    时期已划分类型未划分类型数量/个
    LIGIIA2、IIIA3、IVA4、VA5、IB8、IIB9、IIIB10、IVB11、VB12、VIB13、VIIB14、IC15、IIC16、IIIC17、IVC18、VC19、VIC20、VIIC21、ID22、IID23、IIID24、IVD25、VD26、VID27、VIID28、IE29、IIE30、IIIE31、IVE32、VE33、VIE34、VIIE35、IF36、IIF37、IIIF38、IVF39、VF40、VIF41、VIIF42IA1、VIA6、VIIA739
    LGMIA1、IIA2、IIIA3、IVA4、IB8、IIB9、IIIB10、IVB11、VIB13、IC15、IIC16、IIIC17、IVC18、VC19、VIC20、VIIC21、ID22、IID23、IIID24、IVD25、VD26、VID27、VIID28、IE29、IIE30、IIIE31、IVE32、VE33、VIE34、VIIE35、IF36、IIF37、IIIF38、IVF39、VF40、VIF41、VIIF42VA5、VIA6、VIIA7、VB12、VIIB1437
    MHIIA2、IIIA3、IVA4、VA5、IB8、IIB9、IIIB10、IVB11、VB12、VIIB14、IC15、IIC16、IIIC17、IVC18、VC19、VIC20、VIIC21、ID22、IID23、IIID24、IVD25、VD26、VID27、VIID28、IE29、IIE30、IIIE31、IVE32、VE33、VIE34、VIIE35、IF36、IIF37、IIIF38、IVF39、VF40、VIF41、VIIF42IA1、VIA6、VIIA7、VIB1338
    PDIA1、IIA2、IIIA3、IVA4、VA5、IB8、IIB9、IIIB10、IVB11、VB12、VIB13、VIIB14、IC15、IIC16、IIIC17、IVC18、VC19、VIC20、VIIC21、ID22、IID23、IIID24、IVD25、VD26、VID27、VIID28、IE29、IIE30、IIIE31、IVE32、VE33、VIE34、VIIE35、IF36、IIF37、IIIF38、IVF39、VF40、VIF41、VIIF42VIA6、VIIA740
    2050sIIA2、IIIA3、IVA4、VA5、VIA6、IB8、IIB9、IIIB10、IVB11、VB12、VIB13、VIIB14、IC15、IIC16、IIIC17、IVC18、VC19、VIC20、VIIC21、ID22、IID23、IIID24、IVD25、VD26、VID27、VIID28、IE29、IIE30、IIIE31、IVE32、VE33、VIE34、VIIE35、IF36、IIF37、IIIF38、IVF39、VF40、VIF41、VIIF42IA1、VIIA740
    2070sIIA2、IIIA3、IVA4、VA5、VIA6、IB8、IIB9、IIIB10、IVB11、VB12、VIB13、VIIB14、IC15、IIC16、IIIC17、IVC18、VC19、VIC20、VIIC21、ID22、IID23、IIID24、IVD25、VD26、VID27、VIID28、IE29、IIE30、IIIE31、IVE32、VE33、VIE34、VIIE35、IF36、IIF37、IIIF38、IVF39、VF40、VIF41、VIIF42IA1、VIIA740
    Table 2. Temporal pattern and its variation of potential natural vegetation classes in China
    类组LIGLGMMHPD2050s2070s
    面积/
    万km2
    比例/
    %
    面积/
    万km2
    比例/
    %
    面积/
    万km2
    比例/
    %
    面积/
    万km2
    比例/
    %
    面积/
    万km2
    比例/
    %
    面积/
    万km2
    比例/
    %
    冻原和高山草地142.414.8269.027.9183.619.1207.721.6121.412.6124.112.9
    冷荒漠140.214.6133.113.8128.913.4130.313.594.39.894.19.8
    半荒漠177.618.478.58.184.68.878.88.291.49.593.19.7
    斯泰普73.47.653.85.641.94.353.15.574.07.776.27.9
    温带湿润草地41.24.374.97.862.56.558.16.059.46.261.56.4
    温带森林草地233.424.2284.829.6270.728.1218.722.7233.424.2227.123.6
    热荒漠4.00.4N/AN/A1.50.20.80.145.84.845.34.7
    亚热带森林草地146.415.267.97.0183.719.1196.620.4208.821.7207.521.5
    萨王纳1.40.10.40.00.60.11.30.12.00.22.00.2
    热带森林草地3.40.410.15.40.618.01.932.93.432.53.4
    总计963.4100.0963.4100.0963.4100.0963.4100.0963.4100.0963.4100.0
    Table 3. The distribution area and ratio of super-classes for potential natural vegetation from Last Interglacial to future 2070s in China
    Zheng-chao REN, Hua-zhong ZHU, Hua SHI, Xiao-ni LIU. Spatio-temporal distribution pattern of potential natural vegetation and its response to climate change from Last Interglacial to future 2070s in China[J]. Journal of Natural Resources, 2020, 35(6): 1484
    Download Citation