Author Affiliations
College of Information and Communication Engineering, Harbin Engineering University, Harbin, Heilongjiang 150001, Chinashow less
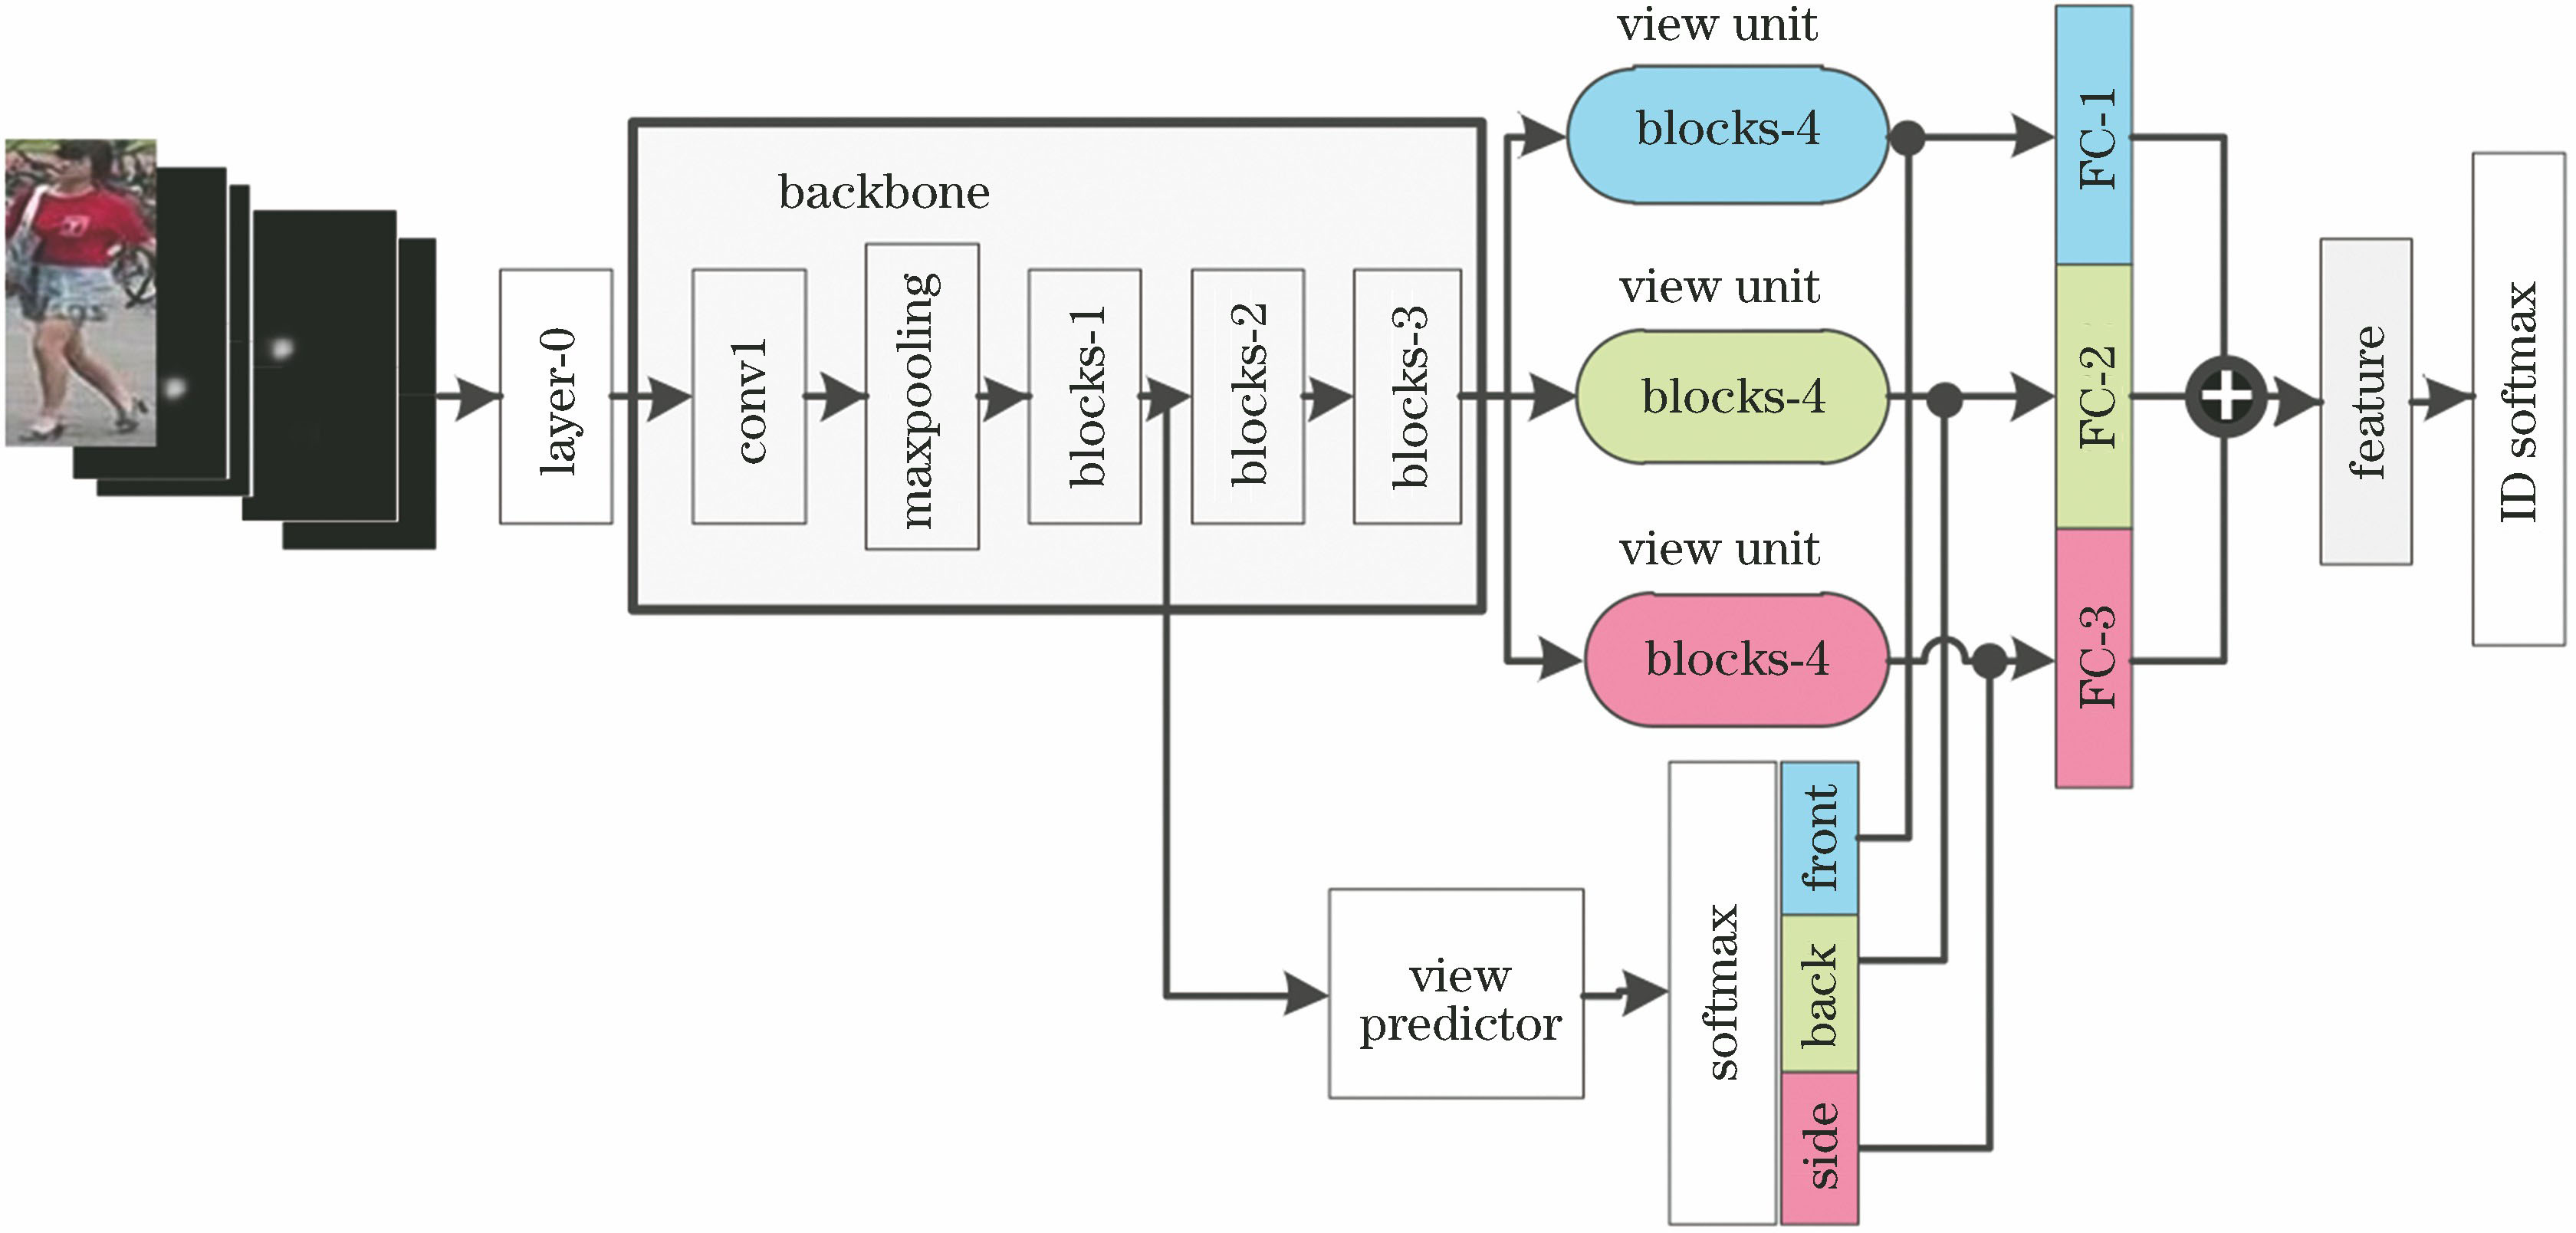
Fig. 1. Structure of PSE network model
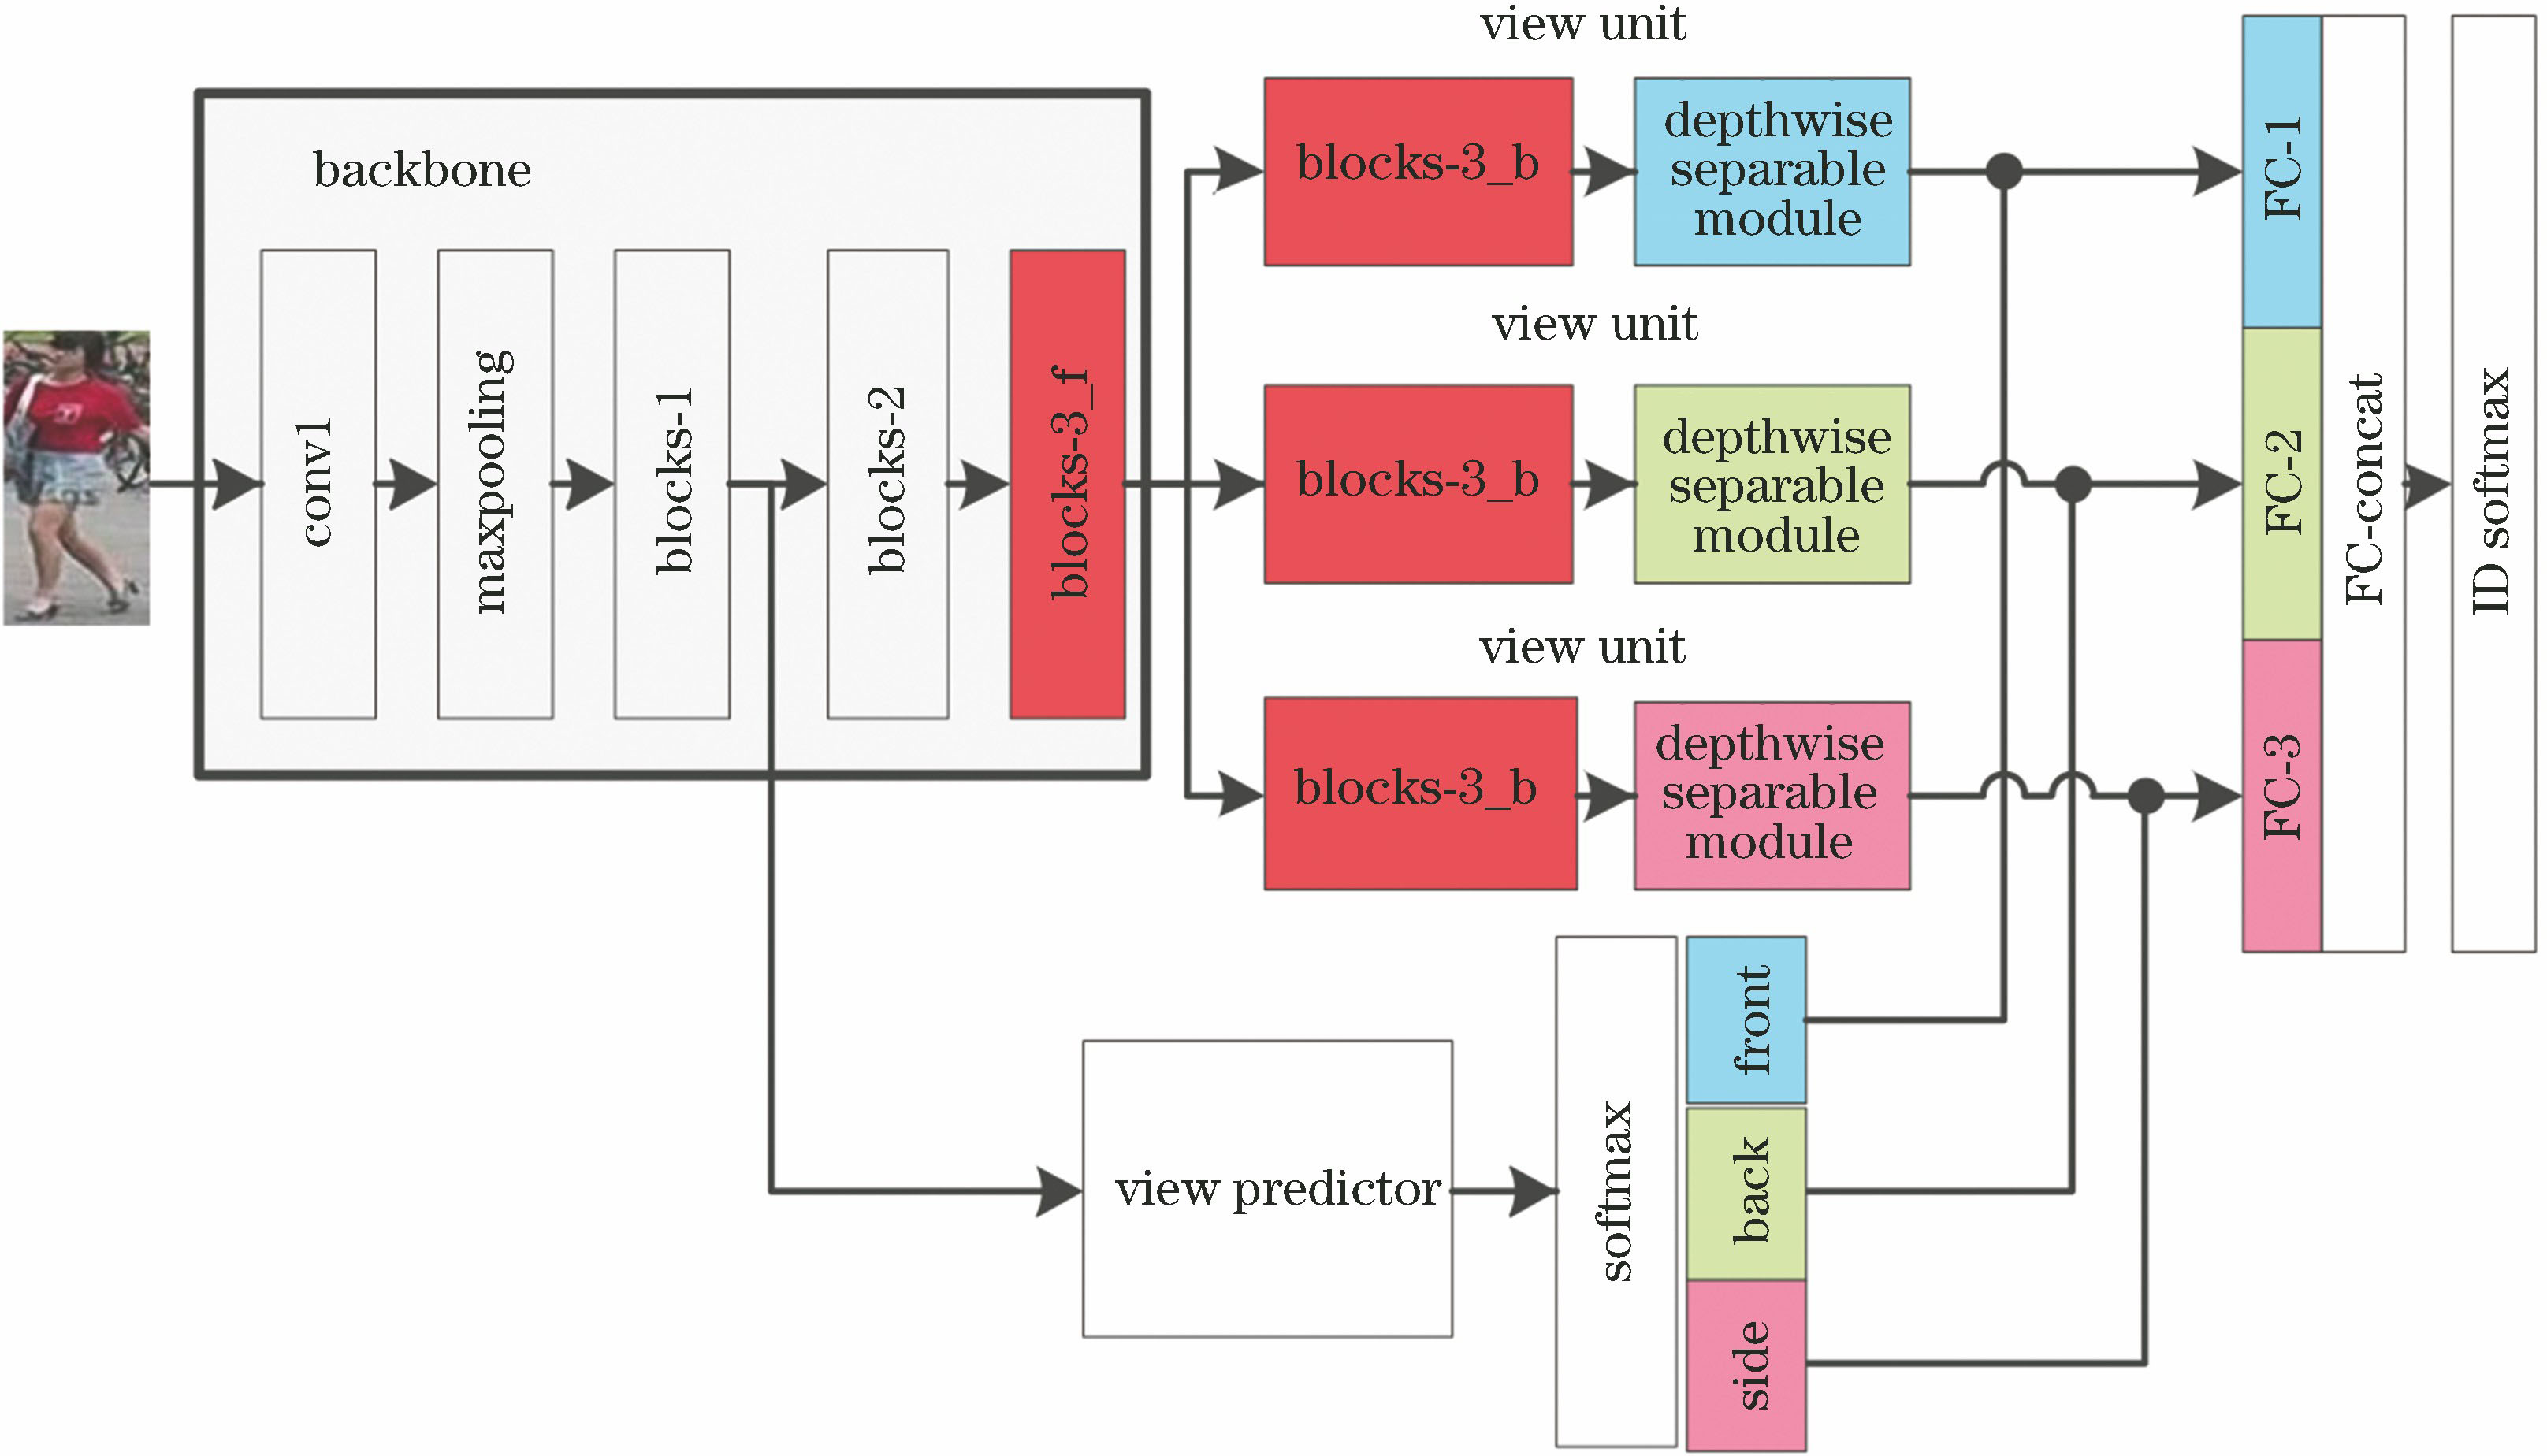
Fig. 2. Model based perspective information embedding
Fig. 3. Depthwise separable convolution
Fig. 4. Improved depthwise separable convolution
Fig. 5. Structure of depthwise separable module
| Method | Market1501 | Duke-MTMC-reID | MARS | | |
|---|
| rank-1 /% | mAP /% | rank-1 /% | mAP /% | rank-1 /% | mAP /% |
|---|
| Proposed | Except perspective | 83.6 | 62.6 | 74.1 | 53.7 | 67.7 | 50.1 | | All | 89.9 | 71.6 | 79.9 | 61.7 | 74.1 | 57.6 |
|
Table 1. Results of perspective predictor module verification experiment
| Method | Market1501 | Duke-MTMC-reID | MARS | | |
|---|
| rank-1 /% | mAP /% | rank-1 /% | mAP /% | rank-1 /% | mAP /% |
|---|
| Proposed | Except SE-Block | 87.0 | 67.5 | 77.8 | 59.6 | 71.2 | 54.2 | | All | 89.9 | 71.6 | 79.9 | 61.7 | 74.1 | 57.6 |
|
Table 2. Results of improved depthwise separable convolution verification experiment
| Method | Market1501 | Duke-MTMC-reID | MARS | | |
|---|
| rank-1 /% | mAP /% | rank-1 /% | mAP /% | rank-1 /% | mAP /% |
|---|
| Proposed | Except Mid-level-feature | 87.4 | 70.9 | 79.5 | 57.8 | 72.1 | 55.9 | | All | 89.9 | 71.6 | 79.9 | 61.7 | 74.1 | 57.6 |
|
Table 3. Verification experiment results of mid-level feature method
| S/N | Improved method | Market1501 | Duke-MTMC-reID | MARS | | | |
|---|
| IM1 | IM2 | IM3 | rank-1 /% | mAP /% | rank-1 /% | mAP /% | rank-1 /% | mAP /% |
|---|
| PSE | ① | - | - | - | 87.7 | 69.0 | 79.8 | 62.0 | 72.1 | 56.9 | | ② | - | - | Y | 86.8 | 66.5 | 77.5 | 60.5 | 70.5 | 54.9 | | ③ | - | Y | - | 82.5 | 64.2 | 70.1 | 54.3 | 68.4 | 49.3 | | ④ | - | Y | Y | 85.3 | 65.8 | 72.5 | 57.2 | 70.2 | 53.8 | | Ours | ⑤ | Y | - | - | 87.5 | 69.0 | 79.4 | 61.1 | 70.9 | 57.1 | | ⑥ | Y | - | Y | 85.9 | 66.5 | 75.6 | 59.9 | 67.8 | 54.6 | | ⑦ | Y | Y | - | 86.6 | 65.6 | 77.4 | 59.4 | 70.1 | 55.1 | | ⑧ | Y | Y | Y | 89.9 | 71.6 | 79.9 | 61.7 | 74.1 | 57.6 |
|
Table 4. Results of improved model verification experiment
| Method | Time /s |
|---|
| Total match | Per match (19720) |
|---|
| PSE | 141.57 | 0.0072 | | Proposed | 288.96 | 0.0147 |
|
Table 5. Results of algorithm running speed comparison experiment
| Method | Market1501 | Duke-MTMC-reID | MARS | | |
|---|
| rank-1 /% | mAP /% | rank-1 /% | mAP /% | rank-1 /% | mAP /% |
|---|
| P2S(point to set) | 70.7 | 44.3 | - | - | - | - | | Spindle | 76.9 | - | - | - | - | - | | Consistent aware | 80.9 | 55.6 | - | - | - | - | | GAN(generative adversarial networks) | 78.1 | 56.2 | 67.7 | 47.1 | - | - | | Latent parts | 80.3 | 57.5 | - | - | 71.8 | 56.1 | | ResNet+OIM(online instance matching) | 82.1 | - | 68.1 | - | - | - | | ACRN(attribute-complementary re-ID net) | 83.6 | 62.6 | 72.6 | 52.0 | - | - | | SVD(singular value decomposition) | 82.3 | 62.1 | 76.7 | 56.8 | - | - | | Part aligned | 81.0 | 63.4 | - | - | - | - | | PDC(pose-driven deep convolutional model) | 84.1 | 63.4 | - | - | - | - | | JLML(jointly learning multi-loss) | 85.1 | 65.5 | - | - | - | - | | DPFL | 88.6 | 72.6 | 79.2 | 60.6 | - | - | | Forest | - | - | - | - | 70.6 | 50.7 | | DGM(dynamic graph matching)+IDE | - | - | - | - | 65.2 | 46.8 | | QMA | - | - | - | - | 73.7 | 51.7 | | ResNet baseline | 82.6 | 59.8 | 71.5 | 50.3 | 64.5 | 49.5 | | PSE | 87.7 | 69.0 | 79.8 | 62.0 | 72.1 | 56.9 | | Proposed algorithm | 89.9 | 71.6 | 79.9 | 61.7 | 74.1 | 57.6 |
|
Table 6. Comparison of algorithm results