• Journal of Geo-information Science
  • Vol. 22, Issue 4, 867 (2020)
Yanzhao YANG1、1、2、2、3、3、*, Tingting LANG1、1、2、2, Chao ZHANG1、1、2、2, and Kun JIA1、1、2、2
Author Affiliations
  • 1Institute of Geographic Sciences and Natural Resources Research, Chinese Academy of Sciences, Beijing 100101, China
  • 1中国科学院地理科学与资源研究所,北京 100101
  • 2University of Chinese Academy of Sciences, Beijing 100049, China
  • 2中国科学院大学,北京 100049
  • 3Key Laboratory of Carrying Capacity Assessment for Resource and Environment, Ministry of Natural Resources, Beijing 101149, China
  • 3自然资源部资源环境承载力评价重点实验室,北京 101149
  • show less
    DOI: 10.12082/dqxxkx.2020.200060 Cite this Article
    Yanzhao YANG, Tingting LANG, Chao ZHANG, Kun JIA. Comparative Study of Different Temperature Interpolation Methods in the Belt and Road Regions based on GIS[J]. Journal of Geo-information Science, 2020, 22(4): 867 Copy Citation Text show less
    Distribution of meteorological stationson the Belt and Road (BR) regions
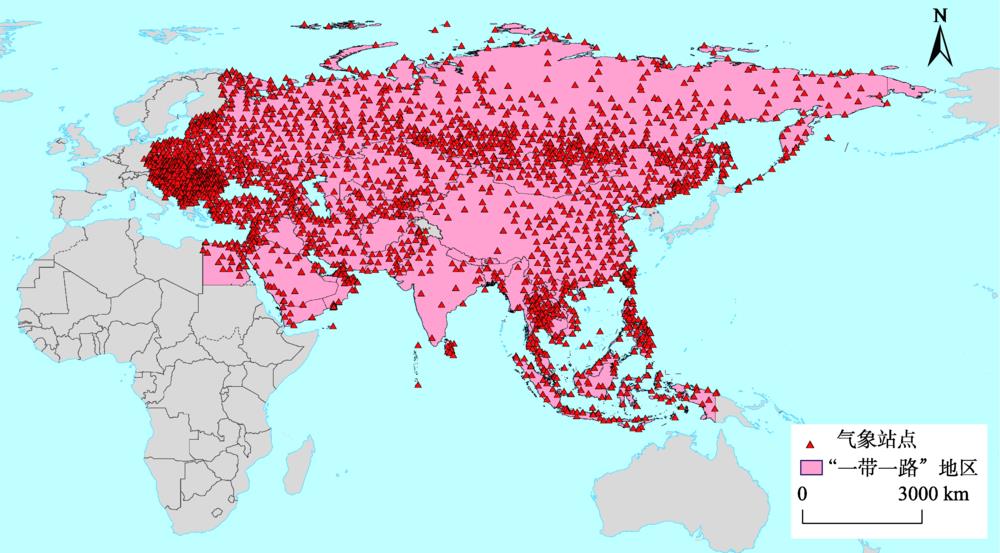
    Fig. 1. Distribution of meteorological stationson the Belt and Road (BR) regions
    Comparison of RMSE based on IDS, RIDS, CK and RCK in the BR regions
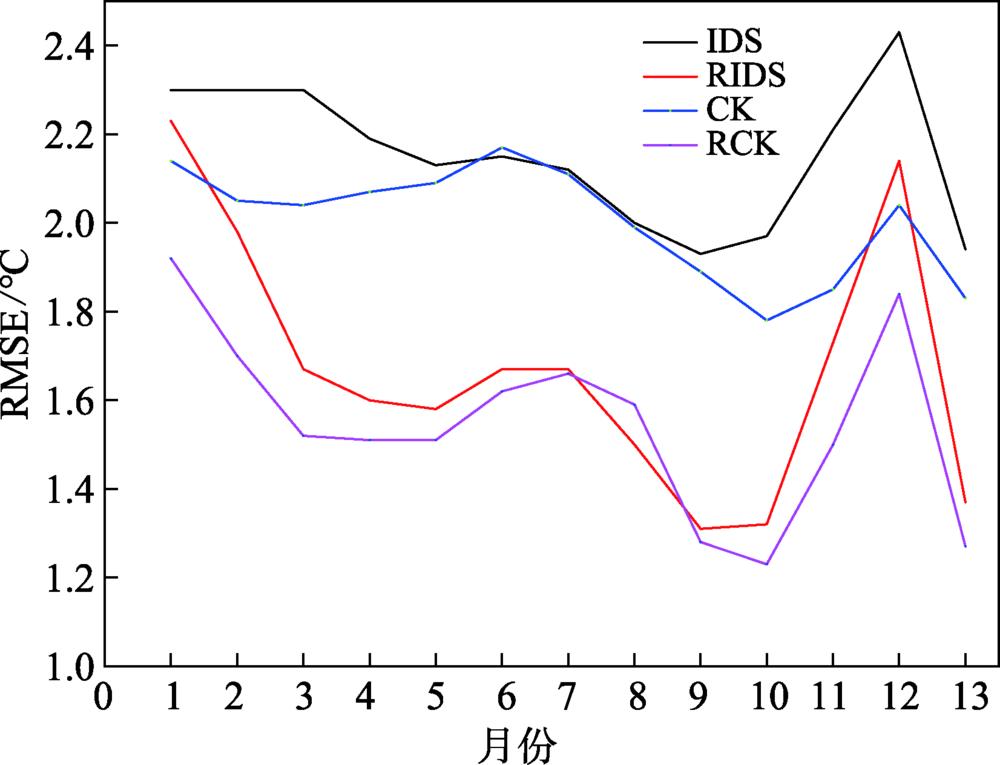
    Fig. 2. Comparison of RMSE based on IDS, RIDS, CK and RCK in the BR regions
    Raster map of annul mean temperature based on IDS, CK, RIDS and RCK methods in the BR regions
    Fig. 3. Raster map of annul mean temperature based on IDS, CK, RIDS and RCK methods in the BR regions
    Raster map of monthly mean temperature based on IDS, CK, RIDS and RCK methods in the BR regions
    Fig. 4. Raster map of monthly mean temperature based on IDS, CK, RIDS and RCK methods in the BR regions
    月份相关系数(λ相关系数(φ相关系数(h复相关系数回归方程 序号
    1-0.115**-0.877**-0.152**0.951Z1=46.648-0.127λ-0.913φ-0.005h(11)
    2-0.085**-0.896**-0.131**0.957Z2=45.946-0.112λ-0.886φ-0.004h(12)
    3-0.052**-0.910**-0.123**0.959Z3=44.328-0.088λ-0.777φ-0.004h(13)
    4-0.008**-0.904**-0.120**0.941Z4=42.320-0.060λ-0.635φ-0.003h(14)
    50.007-0.869**-0.140**0.905Z5=40.040-0.043λ-0.484φ-0.003h(15)
    60.035-0.803**-0.164**0.837Z6=37.136-0.026λ-0.349φ-0.002h(16)
    70.020-0.746**-0.180**0.786Z7=36.040-0.023λ-0.282φ-0.002h(17)
    8-0.009-0.794**-0.171**0.839Z8=37.403-0.031λ-0.324φ-0.002h(18)
    90.001-0.872**-0.174**0.915Z9=38.679-0.040λ-0.434φ-0.003h(19)
    10-0.038**-0.899**-0.162**0.950Z10=41.693-0.064λ-0.594φ-0.004h(20)
    11-0.094**-0.888**-0.147**0.954Z11=45.833-0.102λ-0.785φ-0.004h(21)
    12-0.115**-0.875**-0.156**0.949Z12=46.378-0.122λ-0.874φ-0.005h(22)
    年平均-0.055**-0.901**-0.153**0.956Z年均=41.883-0.070λ-0.612φ-0.003h(23)
    Table 1. Correlation coefficient, multiple correlation coefficient and linear regression equation of mean temperature with latitude, longitude and altitude in the BR regions
    月份IDSRIDSCKRCK
    MERSMEMERMSEMERMSEMERMSE
    10.0262.30-0.0782.230.0072.14-0.0091.92
    20.0382.30-0.0591.980.0062.05-0.0071.70
    30.0302.30-0.0481.670.0042.04-0.0041.52
    40.0032.19-0.0191.600.0022.07-0.0011.51
    5-0.0132.130.0001.580.0032.09-0.0021.51
    6-0.0252.150.0141.670.0072.17-0.0041.62
    7-0.0292.120.0191.670.0032.11-0.0061.66
    8-0.0212.000.0101.500.0031.99-0.0171.59
    9-0.0141.930.0001.310.0021.89-0.0031.28
    100.0191.97-0.0361.320.0041.78-0.0031.23
    11-0.0482.21-0.0681.730.0071.85-0.0071.50
    120.0622.43-0.0862.140.0162.04-0.0101.84
    年均气温0.0131.94-0.0281.370.0031.83-0.0041.27
    Table 2. The results of cross validation errors for IDS, RIDS, CK and RCK in the BR regions (℃)
    Yanzhao YANG, Tingting LANG, Chao ZHANG, Kun JIA. Comparative Study of Different Temperature Interpolation Methods in the Belt and Road Regions based on GIS[J]. Journal of Geo-information Science, 2020, 22(4): 867
    Download Citation