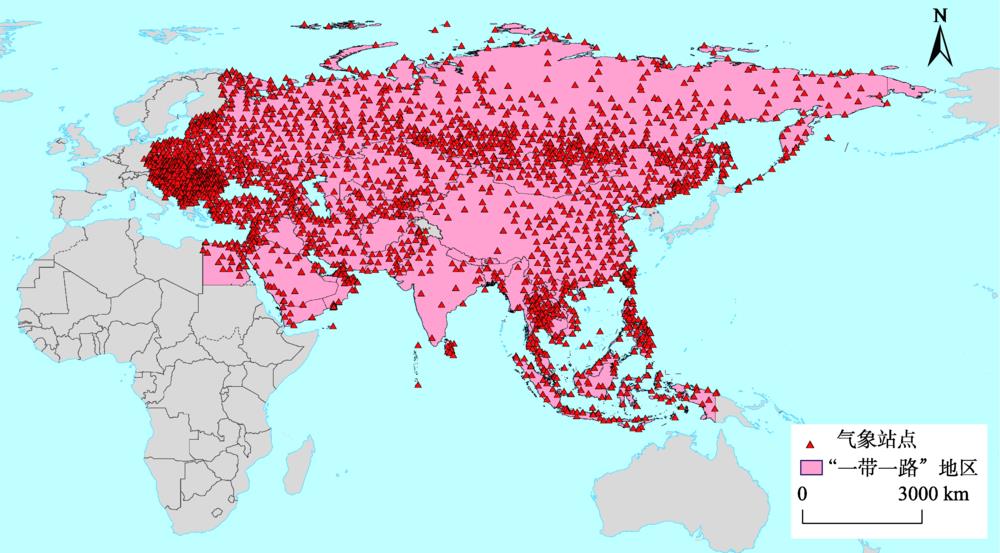

Yanzhao YANG, Tingting LANG, Chao ZHANG, Kun JIA. Comparative Study of Different Temperature Interpolation Methods in the Belt and Road Regions based on GIS [J]. Journal of Geo-information Science, 2020, 22(4): 867
- Journal of Geo-information Science
- Vol. 22, Issue 4, 867 (2020)
Abstract


Set citation alerts for the article
Please enter your email address

© Copyright 2018-2021 | Chinese Laser Press. All Rights Reserved 沪ICP备15018463号-20