

Yiming Sun, Zequn Zhang, Caiwang Tan, Xiaoye Zhao, Bo Chen, Xiaoguo Song, Jicai Feng. Laser Spot Welding Characteristics of Dissimilar Metals: C4 Titanium/5052 Aluminum[J]. Laser & Optoelectronics Progress, 2019, 56(3): 031403
- Laser & Optoelectronics Progress
- Vol. 56, Issue 3, 031403 (2019)
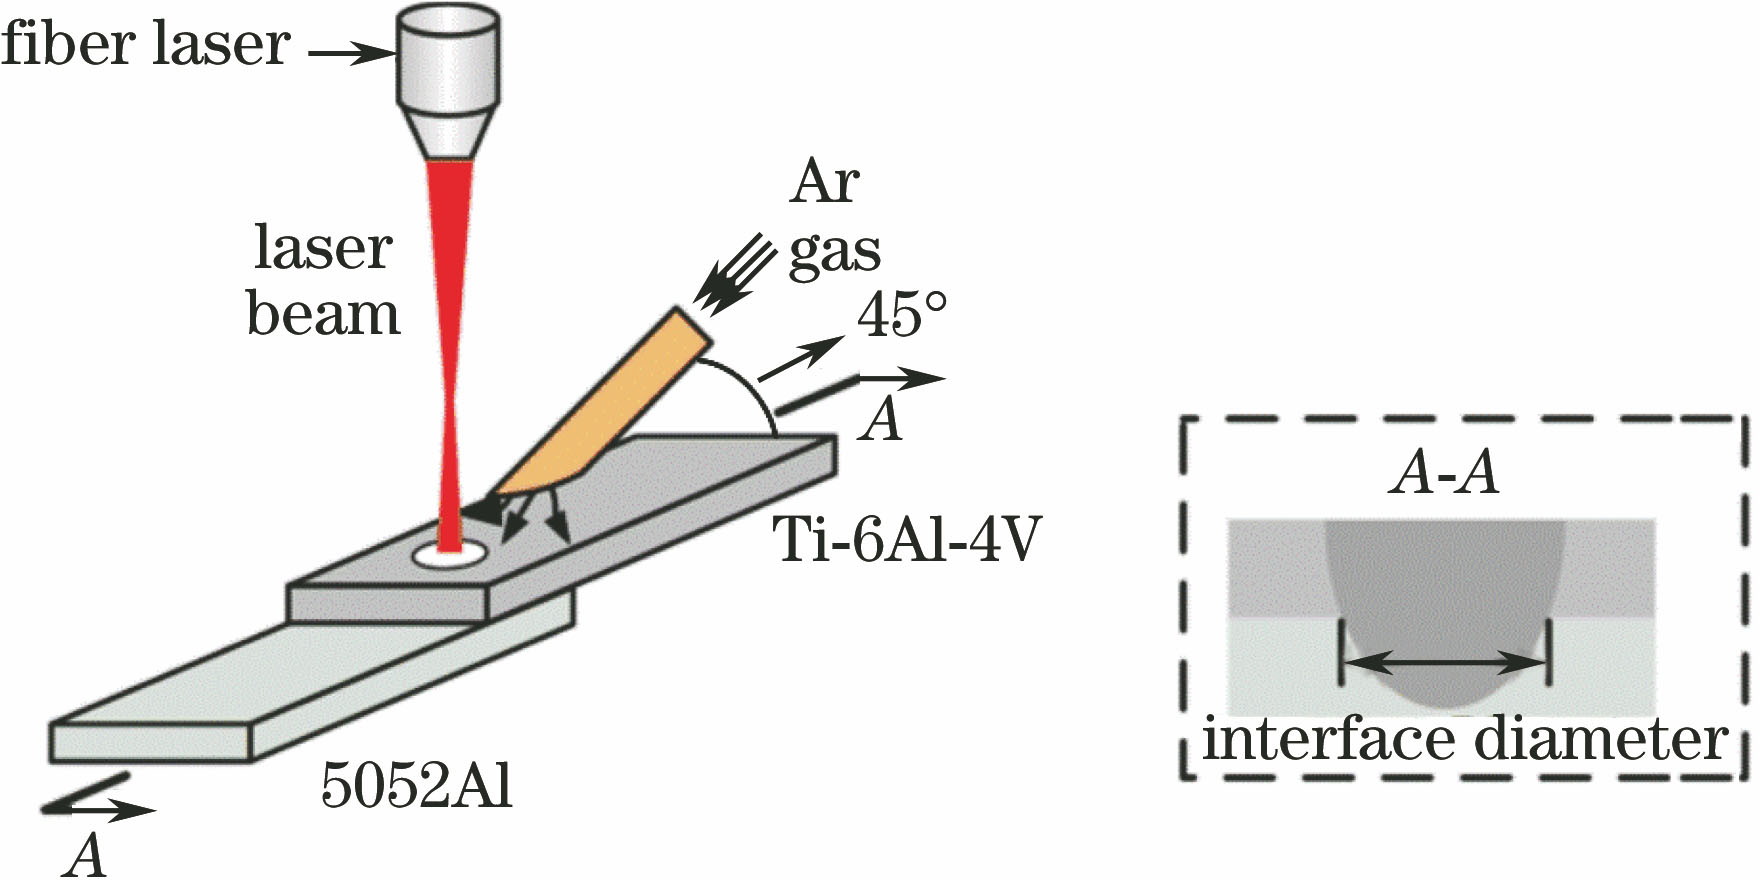
Fig. 1. Schematic of laser spot welding process of Al/Ti
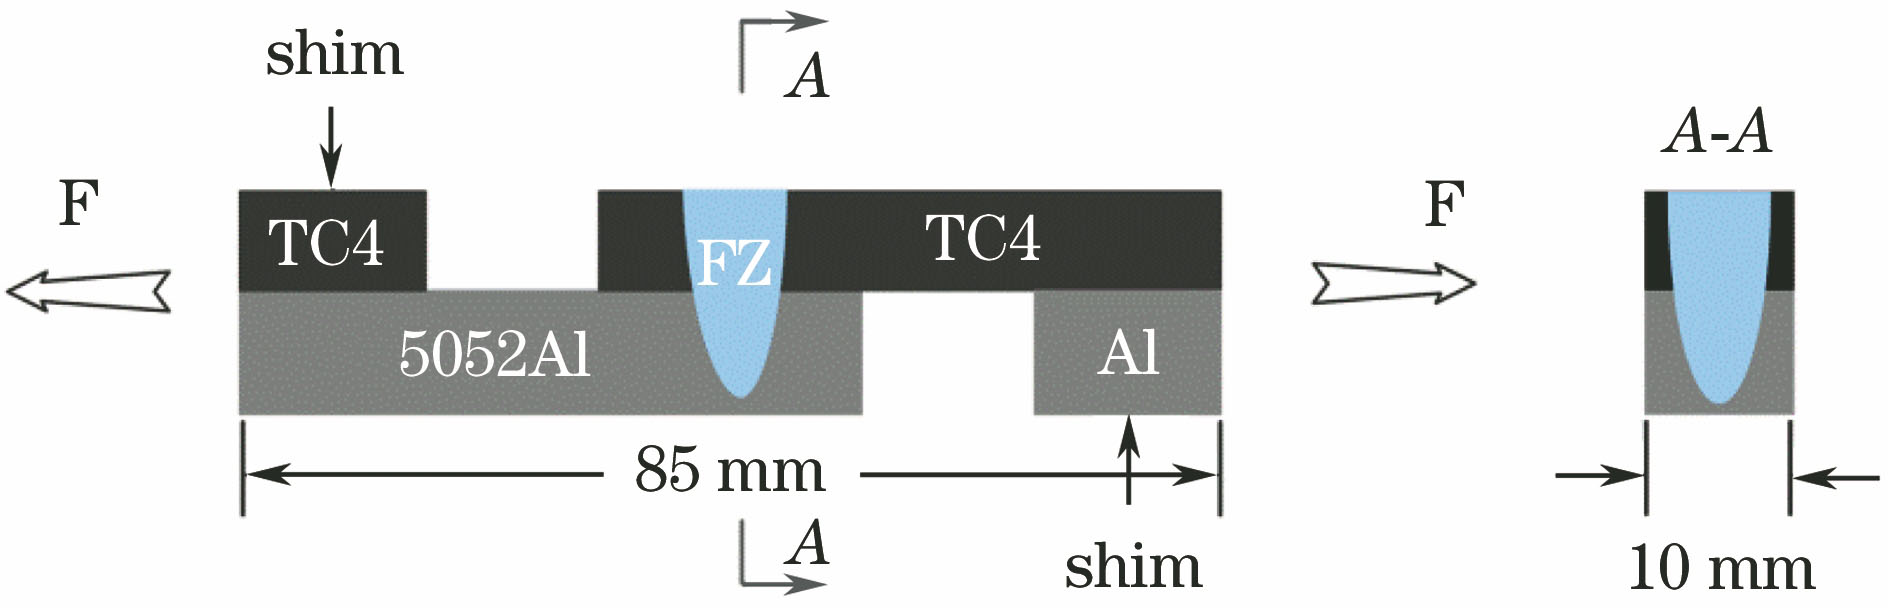
Fig. 2. Specimen for tensile-shear test
Fig. 3. Cross sections of Ti /Al laser spot welding joints with differentdefocusing distance and power. (a) 0 mm, 1200 W; (b) 0 mm, 1500 W; (c) 0 mm, 2100 W; (d) +20 mm, 2300 W; (e) +20 mm, 2900 W; (f) +20 mm, 3300 W; (g) +40 mm, 3300 W; (h) +40 mm, 3700 W; (i) +40 mm, 3900 W; (j) +50 mm, 3700 W; (k) +50 mm,4700 W; (l) +50 mm, 4900 W
Fig. 4. Interfacial morphologies of Ti/Al with different laser powers. (a) Interfacial macro-morphology with laser power of 3700 W; (b) zone B; (c) interfacial macro-morphology with laser power of 4700 W; (d) zone D; (e) zone E; (f) zone F
Fig. 5. Relationship between laser power and tensile-shear force with various defocusing distance. (a) 0 mm; (b) +20 mm; (c) +40 mm; (d) +50 mm
Fig. 6. Schematic of microstructure evolution on the Ti/Al interface with different laser powers. (a) 3300 W; (b) 3700 W; (c) 4500 W; (d) 4700 W
Fig. 7. Fracture location and fracture surface with different laser powers. (a) 3700 W; (b) zone B; (c) zone C; (d) 4700 W; (e) zone E
|
Table 1. Chemical composition of 5052 aluminum alloy (mass fraction, %)
|
Table 2. Chemical composition of TC4 titanium alloy (mass fraction, %)
|
Table 3. Welding parameters adopted in the experiment
Table 4. Joint appearances of Ti/Al laser spot welding joints with different welding parameters
| |||||||||||||||||||||||||||||||||||||||||||||||
Table 5. EDS analysis result of the point shown in Fig. 4
| |||||||||||||||||||||||||||||
Table 6. EDS analysis results of the point shown in Fig. 7

Set citation alerts for the article
Please enter your email address
© Copyright 2018-2021 | Chinese Laser Press. All Rights Reserved 沪ICP备15018463号-20