
Qing Chang, Hengyu Tan, Tianming Meng. Nonlinear optics and ultrafast dynamics characteristics of CdTe/CdS quantum dots with different core sizes and shell thickness[J]. Infrared and Laser Engineering, 2021, 50(2): 20200342
- Infrared and Laser Engineering
- Vol. 50, Issue 2, 20200342 (2021)
Abstract
Keywords
0 Introduction
The optical and electronic properties of quantum dots are different from those of large particles or bulk materials[
The CdTe core-shell semiconductor quantum dots have aroused widespread attention over the past few decades due to their unique nonlinear optics and ultrafast dynamics characteristics, which endow them with potential applications including solar cells[
In this work, the nonlinear optics and ultrafast dynamics properties of colloidal CdTe/CdS quantum dots synthesized by the TGA passivation surface method were studied. Meanwhile, the femtosecond Z-scan and time-resolved transient absorption spectroscopy technology were used to measure the nonlinear absorption, nonlinear refraction and ultrafast dynamics characteristics of CdTe/CdS quantum dots with different sizes of core and shell, and consequently to research the effects of core-shell structure on the nonlinear optics and ultrafast dynamics characteristics of quantum dots.
1 Material and experiments
1.1 Preparation of the CdTe/CdS quantum dots
The CdTe/CdS quantum dots were synthesized and improved according to the Ref.[8]. Typically, took 500 mL of deionized water and put it into a 1000 mL three-necked flask, then added 0.4565 g of CdCl2·2.5 H2O, 0.310 mL of TGA solution, passed in N2, and stirred. The PH value were respectively adjusted to about 9.0, 10.0 and 11.0 with 1 mol/L NaOH solution. Repeated the above experiment three times, and the reflux time were 30 minutes, 1 h and 2 h, respectively. After the reaction, the three-necked flask was cooled to room temperature quickly with cold water.
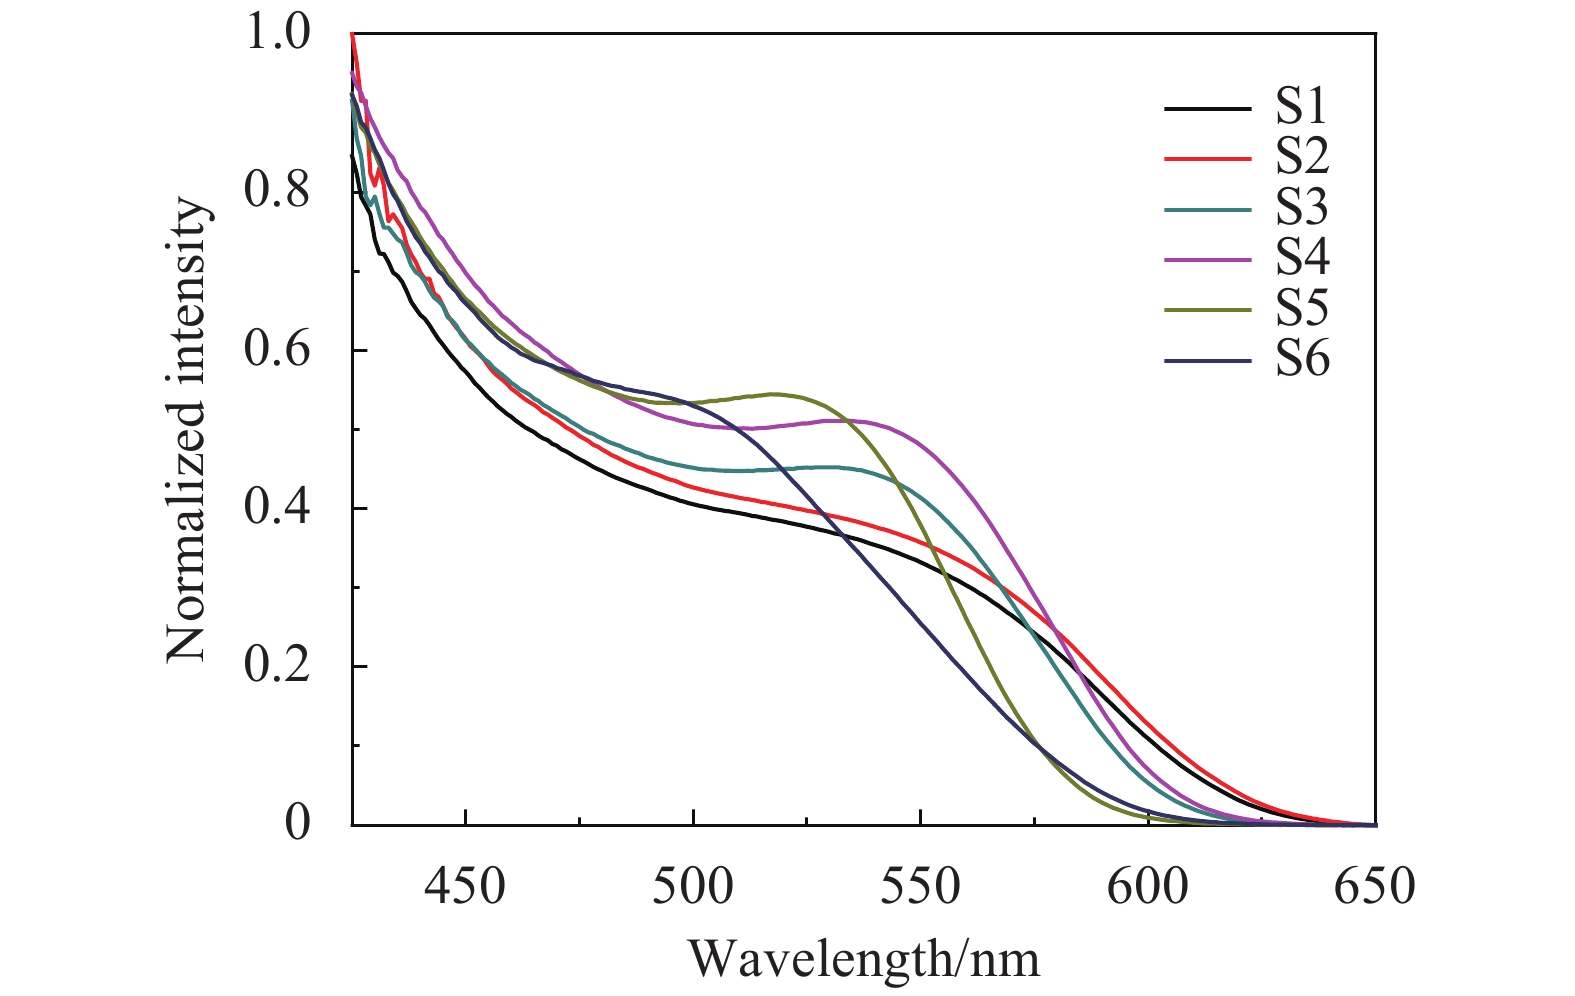
The obtained the CdTe/CdS quantum dot solution was putted into the centrifuge tube, and the ratio of the CdTe/CdS quantum dots to the ethanol in the solution was 1∶2 to 1∶4 (volume ratio), and centrifuged in a high-speed centrifuge, with the rotation speed of 10000 r/min and the time was set for 10 minutes. To sum up, the 6 kinds of water-soluble core-shell quantum dots for UV-Vis absorption spectra are shown in Fig.1.
![]()
Figure 1.Absorption spectra of the CdTe/CdS quantum dots
Yu's team[
| Sample number | Quantum dots | Size /nm | Core color | Cladding time |
| S1 | CdTe/CdS-1 | 3.2 | Orange | 30 min |
| S2 | CdTe/CdS-2 | 3.3 | orange | 1 h |
| S3 | CdTe/CdS-3 | 3.0 | Yellow | 30 min |
| S4 | CdTe/CdS-4 | 3.1 | Yellow | 1 h |
| S5 | CdTe/CdS-5 | 2.6 | Green | 30 min |
| S6 | CdTe/CdS-6 | 2.7 | Green | 1 h |
Table 1. Six kinds of the CdTe/CdS core-shell quantum dots
1.2 Z-Scan experimental device and principle
The femtosecond Z-scan setup have been described previously in the Ref.[10]. The Z-Scan measurements were carried out by a Ti: Sapphire solid femtosecond laser (Coherent Inc, USA), which regenerative amplifer with the repetition of 1 kHz was set to be 130 fs pulse width, and the single-pulse energy was 400 nJ. The central wavelength was 800 nm for this equipment. The laser beam waist radius was measured to be 90 nm by blade method and the linear transmittance of the pin-hole was 0.2 with 2 mm thickness of the sample pool. Three groups of CdTe/CdS quantum dots (S1-S2 of orange core, S3-S4 of yellow core, S5-S6 of green core) with the same cladding material and different core luminescence were selected for comparative testing.
The sample was placed on a movable platform at the focal point of the lens, which moves from the laser to the detector. After the laser pulse passed through the beam splitting, the first beam was reflected to the detector D1, while another beam was transmitted to the detector D2, which were used to measure the nonlinear absorption and refraction coefficients respectively.
The transmittance of the Z-Scan experimental medium can be expressed by Eq.2 and Eq.3, thus the nonlinear absorption coefficient and the nonlinear refraction coefficient can be calculated[
Where, I0 is the maximum light intensity at the laser focus, E is the laser single pulse energy, ω0 is the radius of the laser beam waist at the focal point, τ is the pulse width,
When the peak and valley asymmetry occurs, the Eq.4[
The nonlinear susceptibility is divided into the real and the imaginary part, which respectively represent the nonlinear refraction and the nonlinear absorption characteristics. According to the Eq.5 to 7, the third-order nonlinear susceptibility (χ(3)) can be calculated.
1.3 Experimental equipment and principle of the femtosecond transient absorption
For the purpose of appraising the ultrafast dynamics characteristics of CdTe/CdS quantum dots with different sizes of core and shell, the the ultrafast dynamics process was investigated through femtosecond time-resolved transient absorption spectra technique. The experimental device have been described previously in the Ref.[13]. The laser pulse generated by Ti: sapphire regenerative amplifer with the repetition of 1 kHz (Coherent INC, USA) was set to be 130 fs pulse width, and the single-pulse energy was 5 nJ. The sample pool thickness was 2 mm and the central wavelength was 400 nm for this equipment. The fundamental laser beam was split into two and one of them was used as pump beam to excite the sample. The other beam was used as a probe beam to detect the particle distribution of the excited state sample. In Eq.8, the abscissa is the detection wavelength, and the ordinate is the variation of absorbance, which select the delay time of 0.2 ps, 2 ps, and 12 ps for the experimental data, respectively.
Where ΔA is the variation of absorbance, Iprobe is the intensity of probe beam passing through the sample without pump beam, Ipump-probe is the intensity of probe beam passing through the sample with the pump beam excitation.
The signal-to-noise ratio (SNR) is greatly improved through the chopper to remove background noise by cutting a half of the pulses. The final signal data can be expressed by Eq.9.
Where Inoise is a noise signal that blocks both the pump and the probe beam, whileInoise-pump is a noise signal that blocks only the probe beam.
2 Results and discussion
2.1 Nonlinear optics properties of the CdTe/CdS core-shell semiconductor quantum dots
Selecting the CdTe/CdS sample S1-S6, of which the core color of the CdTe was orange, yellow and green, and the core size of different colors was different. The cladding time were 30 mins and 1 h respectively, which was to differ the thickness of the shell. With the increase of the cladding time, the thickness increases gradually. The linear transmittance was 95% and the monopulse energy was 400 nJ.
The Z-Scan experimental data of S1 to S6 were shown in Figs.2 to 4 through open aperture and closed aperture Z-Scan measurements. From the experimental data of S1 and S2, it observed that the open aperture Z-Scan experimental plot showed all shaped like valleys, indicated that the nonlinear absorption was the reverse saturation absorption and the nonlinear absorption coefficient was positive. Correspondingly, a valley followed by a peak in closed aperture Z-Scan experimental trace was the mark for the positive nonlinear refraction of the sample which is an indication of self-focusing effect. By fitting the experimental data, the nonlinear absorption coefficient, the nonlinear refraction coefficient and the third-order nonlinear susceptibility can be obtained. The results showed that the nonlinear absorption of the samples was reverse saturation absorption and accompanied by two-photon absorption.
![]()
Figure 2.Open/closed aperture Z-scan normalized transmittance curves of water-soluble CdTe/CdS, S1-S2 quantum dots
![]()
Figure 4.Open/closed aperture Z-scan normalized transmittance curves of water-soluble CdTe/CdS, S5-S6 quantum dots
![]()
Figure 3.Open/closed aperture Z-scan normalized transmittance curves of water-soluble CdTe/CdS, S3-S4 quantum dots
Since the sample was the water-soluble quantum dots, the linear refractive index of the sample can be replaced by solution with a value of 1.33. The data calculated by fitting were shown in Tab.2.
| Sample name | Core color | Shell | Size/nm | |||
| S1 | Orange | CdS-30 min | 3.2 | 4.39 | 1.42 | 3.85 |
| S2 | Orange | CdS-1 h | 3.3 | 5.01 | 1.49 | 4.12 |
| S3 | Yellow | CdS-30 min | 3.0 | 5.07 | 1.38 | 3.90 |
| S4 | Yellow | CdS-1 h | 3.1 | 5.29 | 1.85 | 4.92 |
| S5 | Green | CdS-30 min | 2.6 | 5.23 | 1.18 | 3.58 |
| S6 | Green | CdS-1 h | 2.7 | 6.42 | 1.73 | 4.92 |
Table 2. Nonlinear optical parameters obtained from Z-scan measurement data for CdTe/CdS quantum dots
It is obvious that the core size of green is the smallest compared with the other color for the same of cladding material and time in the Tab.2. That is because of that the luminescence produced redshift by the increase of the core size under the ultraviolet radiation. As a result, the nonlinear absorption in the same shell thicknesses, such as the sample of S1, S3, and S5, stronger with the smaller of core size. It is obvious that the influence of the core size on the nonlinear refraction coefficient is irregular, so that the core size of CdTe/CdS core-shell quantum dots mainly affect the nonlinear absorption characteristics. The size of particles increases with the cladding time, such as S1 and S2 samples, which the cladding time were 30 min and 1 h respectively, as given in Tab.2. This means that the shell thickness has the particular influence on the nonlinear absorption, nonlinear refraction and third-order nonlinear susceptibility.
2.2 Ultrafast dynamics characteristics of CdTe/CdS quantum dots
The femtosecond transient absorption spectra of CdTe/CdS quantum dots as shown in Figs.5-7.
![]()
Figure 5.Transient absorption spectra of water-soluble CdTe/ CdS, S1-S2 quantum dots
![]()
Figure 6.Transient absorption spectra of water-soluble CdTe/ CdS, S3-S4 quantum dots
![]()
Figure 7.Transient absorption spectra of water-soluble CdTe/ CdS, S5-S6 quantum dots
As shown in Fig.6, a bleaching of ground state was clearly observed in transient absorption spectra. As the delay time increases, the bleaching peaks of S1 to S6 produced the redshift. At the same time, in contrast to the position of the UV-VIS spectrum where also produced the redshift. In Fig.5, there was a short wavelength range of the pump beam induced absorption in the left of the bleaching peak when the delay time is 0.2 ps. And as the delay time increases, absorption band of long wavelength appearing on the right side. Correspondingly, as the size of quantum dots decreases, for example, from S2 to S1, the position of the bleaching peaks appeared blue shift. The femtosecond laser wavelength of 400 nm is large than the band gap of the quantum dot (S1 to S6), which makes the photon of the pump beam energy relatively large. And the part of excess energy is lost by a certain form, which like the heat energy. One can see that the bleaching of ground states are gradually decreased when the delay time changes from 0.2 ps to 2 ps and then to 12 ps. This is a process of the exciton recombination in the quantum dots. The absorption band of the long wavelength on the right side gradually strengthens, indicating the conversion of photon energy into heat energy.
Selecting the absorption peak wavelength to draw the kinetic curves on the basis of the UV-VIS absorption spectra of the sample. The absorption peaks of S1 to S6 are 550 nm, 555 nm, 540 nm, 545 nm, 510 nm and 515 nm, respectively. The abscissa is the delay time, and the ordinate is the variation of the normalization in absorbance, as shown in Fig.8 to 10.
![]()
Figure 8.Ultrafast kinetic curves of water-soluble CdTe/CdS, S1-S2 quantum dots
![]()
Figure 10.Ultrafast kinetic curves of water-soluble CdTe/CdS, S5-S6 quantum dots
![]()
Figure 9.Ultrafast kinetic curves of water-soluble CdTe/CdS, S3-S4 quantum dots
In the Fig.8 to 10 , all the time zeros were 13.3 ps. These ultrafast kinetics curves were fitted by biexponential decay (
| Sample name | Size | |||
| S1 | 3.2 | 0.34 | 1.06 | 17.81 |
| S2 | 3.3 | 0.33 | 1.98 | 18.43 |
| S3 | 3.0 | 0.35 | 1.13 | 13.79 |
| S4 | 3.1 | 0.59 | 2.13 | 38.24 |
| S5 | 2.6 | 0.31 | 1.74 | 12.77 |
| S6 | 2.7 | 0.32 | 1.79 | 16.78 |
Table 3. CdTe/CdS quantum dots fitting parameters
![]()
Figure 11.Transient absorption spectrum of the solvent water
The fit parameters are summarized in Tab.3. As shown in the table, the τ-rise was the time of rising to the bleaching maximum. The τ1 refered to the time of fast-decay process, which depended on the relaxation time of the electrons captured on the surface of the CdTe core[
In Tab.3, the τ-rise increased with the the shell thickness, such as the samples of S1 and S2. Overall, the τ1 and τ2 increased with the shell thickness, such as the samples of S1 and S2; at the same time, the τ1 increased with the core size, such as the samples of S1, S3, and S5. The existence of the CdS shell effectively weakens the influence of surface effect. When the shell thickness was very thin, the electrons were captured on the surface, which was the main reason for above-mentioned phenomenon. With the increase of the shell thickness, the electrons of the core were transferred, and the electron distribution of the shell increased. At this time, electron hole pairs were separated in the space, and the carrier relaxation at the interface between the core and the shell was the main factor. Hence, it’s going to be longer for the time of two decay processes. The time of rising to the bleaching maximum increased with the shell thickness. It is indicates that the time for electron hole pairs to separate in the space was greater than the time required for recombination, and their time difference increased with the shell thickness.
3 Conclusion
In this paper, the water-soluble colloidal CdTe/CdS quantum dots were synthesized by the TGA passivation surface method. The femtosecond Z-Scan measurement and time-resolved transient absorption spectroscopy technique were used to study the influence on the different sizes of core-shell structures in the nonlinear absorption, nonlinear refraction and ultra-fast dynamics characteristics of CdTe/CdS quantum dots.
The Z-scan results show that the shell thickness affects the nonlinear absorption and refraction, which increase with the shell thickness. The core size mainly affects the nonlinear absorption coefficient, which decreases with the increase of the core size. It is obvious that the influence of the core size on the nonlinear refraction coefficient is irregular. The nonlinear absorption characteristics of CdTe/CdS quantum dots with the same shell thickness enhance with the decrease of core size. Correspondingly, the core size that the nonlinear refraction characteristics are affected less. But the nonlinear refraction coefficient increase with the shell thickness. The core size of CdTe/CdS core-shell quantum dots mainly affects the nonlinear absorption characteristics, while the shell thickness that the nonlinear absorption characteristics, nonlinear refraction characteristics and third-order nonlinear susceptibility are produced the regular influence. It is obvious that there are three values increased with the shell thickness. Indicating, as the shell thickness increases, the nonlinear optical properties are enhanced within 2 h of cladding time. After that, the samples of quantum dots were tested by femtosecond time-resolved transient absorption spectroscopy. The results suggested that the rising time of bleaching signal increases with the shell thickness. The decay time of the fast process increases with the shell thickness and core size. And the decay time of the slow process increases with the shell thickness. By studying the ultrafast kinetic curves of different absorption wavelengths, it is found that the exciton lifetime of quantum dots at the absorption peak is longer than the non-absorption peak. Indicating that the exciton lifetime of quantum dots is related to the absorption wavelength.
References
[10] Yinglin Song, Zhongguo Li. Ultrafast nonlinear refractive effect and mechanism of solvent nitrobenzene. Infrared and Laser Engineering, 46, 0502001(2017).

Set citation alerts for the article
Please enter your email address
© Copyright 2018-2021 | Chinese Laser Press. All Rights Reserved 沪ICP备15018463号-20