Author Affiliations
1College of Geoexploration Science and Technology, Jilin University, Changchun 130012, Jilin , China2Aerospace Information Research Institute, Chinese Academy of Sciences, Beijing 100094, China3National Satellite Meteorological Center, China Meteorological Administration, Beijing 100081, China4China Center for Resources Satellite Data and Application, Beijing 100094, Chinashow less
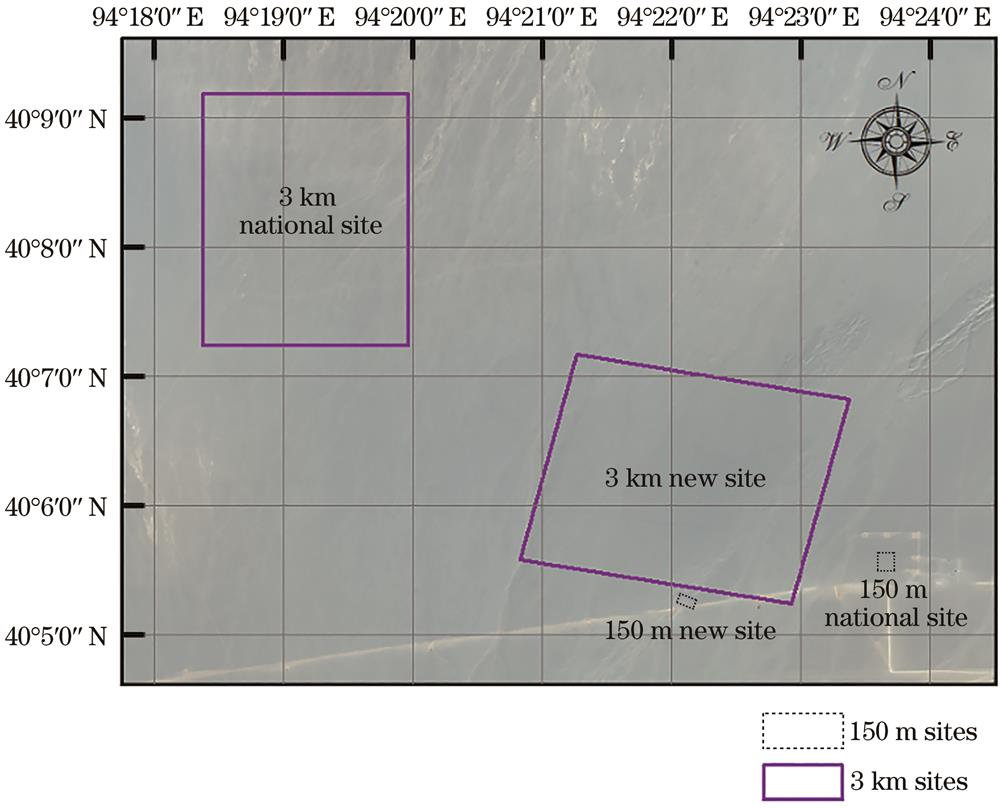
Fig. 1. Schematic diagram of site location
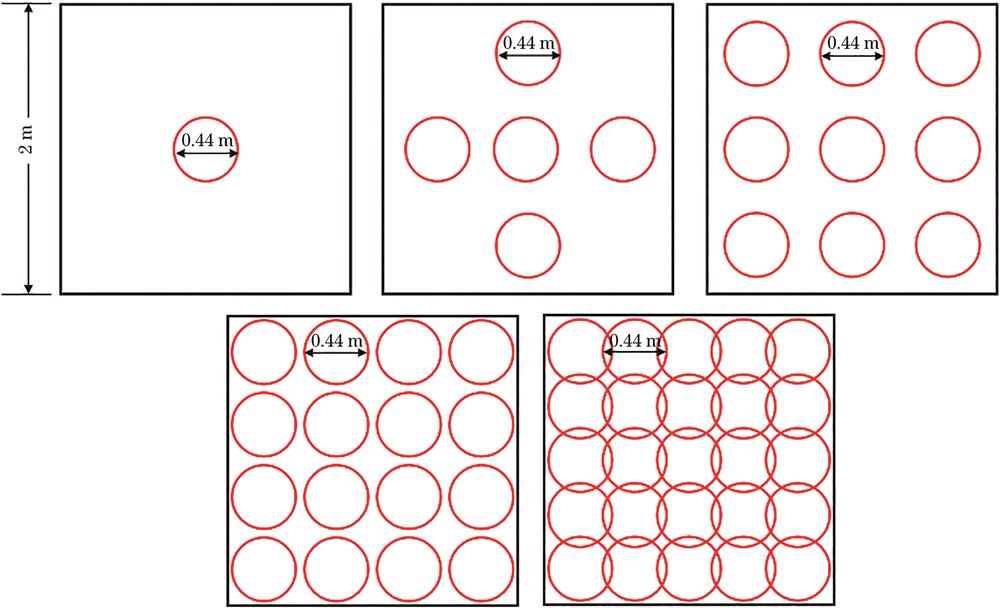
Fig. 2. Sampling distribution of spectrometer system in 2 m basic sampling unit
Fig. 3. Sampling distribution of basic sampling unit system in pixel scale
Fig. 4. Schematic diagram of ground measurement accuracy analysis
Fig. 5. Schematic of ground spectrum measurement
Fig. 6. UAV data simulation ground measurement point scale
Fig. 7. Schematic diagram of UAV data clipping
Fig. 8. Sampling average relative error from ground point scale to 2 m surface scale. (a) R band; (b) G band; (c) B band; (d) RGB bands
Fig. 9. Sampling relative error from 2 m to 150 m scale. (a) 150 m new site; (b) 150 m national site
Fig. 10. Sampling relative error from 2 m to 3 km scale. (a) 3 km new site; (b) 3 km national site
Fig. 11. Sampling scheme from 2 m to 3 km. (a) Distribution of 5-point simulated annealing sampling points; (b) distribution of 16-point simulated annealing sampling points; (c) distribution of 25-point simulated annealing sampling points
Site corner | Northwest corner | Southwest corner | Southeast corner | Northeast corner |
---|
150 m national site | Longitude | 94.39355 | 94.39355 | 94.39485 | 94.39485 | Latitude | 40.0936 | 40.09198 | 40.0936 | 40.09198 | 150 m new site | Longitude | 94.36781 | 94.36745 | 94.36919 | 94.36955 | Latitude | 40.08849 | 40.08718 | 40.08692 | 40.08821 | 3 km national site | Longitude | 94.30625 | 94.30625 | 94.33271 | 94.33271 | Latitude | 40.15317 | 40.12079 | 40.15317 | 40.12079 | 3 km new site | Longitude | 94.35431 | 94.34690 | 94.38210 | 94.38953 | Latitude | 40.11939 | 40.09293 | 40.08729 | 40.11376 |
|
Table 1. Site longitude and latitude coordinate information
Site | From 2013 to 2015 | From 2016 to 2019 | Total number of images |
---|
150 m | National site | 4 | 15 | 19 | New site | 7 | 15 | 22 | 3 km | National site | 11 | 9 | 20 | New site | 5 | 13 | 18 |
|
Table 2. Data list of GF-1 in four sites
Sample number | 1 | 2 | 3 | 4 | 5 |
---|
Longitude | 94.3942 | 94.3942 | 94.39376 | 94.39464 | 94.3942 | Latitude | 40.09333 | 40.09225 | 40.09279 | 40.09279 | 40.09279 |
|
Table 3. Longitude and latitude coordinates of sampling points in 5-point system of 150 m national site
Sample number | 1 | 2 | 3 | 4 | 5 | 6 | 7 | 8 |
---|
Longitude | 94.39371 | 94.39404 | 94.39436 | 94.39469 | 94.39371 | 94.39404 | 94.39436 | 94.3947 | Latitude | 40.0934 | 40.0934 | 40.0934 | 40.0934 | 40.09299 | 40.09299 | 40.09299 | 40.09299 | Sample number | 9 | 10 | 11 | 12 | 13 | 14 | 15 | 16 | Longitude | 94.39371 | 94.39404 | 94.39436 | 94.3947 | 94.39371 | 94.39404 | 94.39436 | 94.3947 | Latitude | 40.09259 | 40.09259 | 40.09259 | 40.09259 | 40.09219 | 40.09219 | 40.09219 | 40.09219 |
|
Table 4. Longitude and latitude coordinates of sampling points in 16-point system of 150 m national site
Sample number | 1 | 2 | 3 | 4 | 5 |
---|
Longitude | 94.35794 | 94.38047 | 94.38589 | 94.35839 | 94.36292 | Latitude | 40.11092 | 40.09074 | 40.10985 | 40.10998 | 40.10344 |
|
Table 5. Longitude and latitude coordinates of 5 simulated annealing sampling points in 3 km new site
Sample number | 1 | 2 | 3 | 4 | 5 | 6 | 7 | 8 |
---|
Longitude | 94.37661 | 94.38198 | 94.3633 | 94.37024 | 94.36929 | 94.36194 | 94.38296 | 94.37824 | Latitude | 40.10553 | 40.09679 | 40.11004 | 40.09793 | 40.10714 | 40.10528 | 40.1134 | 40.10137 | Sample number | 9 | 10 | 11 | 12 | 13 | 14 | 15 | 16 | Longitude | 94.35699 | 94.37405 | 94.35687 | 94.37615 | 94.36508 | 94.37066 | 94.38875 | 94.35792 | Latitude | 40.11773 | 40.09708 | 40.09814 | 40.09909 | 40.0952 | 40.09207 | 40.11327 | 40.10937 |
|
Table 6. Longitude and latitude coordinates of 16 simulated annealing sampling points in 3 km new site
Sample number | 1 | 2 | 3 | 4 | 5 |
---|
Longitude | 94.38061 | 94.37741 | 94.35877 | 94.35501 | 94.37336 | Latitude | 40.11184 | 40.10114 | 40.10091 | 40.10985 | 40.10837 | Sample number | 6 | 7 | 8 | 9 | 10 | Longitude | 94.37999 | 94.38068 | 94.35145 | 94.38157 | 94.36702 | Latitude | 40.10211 | 40.09279 | 40.10821 | 40.09507 | 40.10055 | Sample number | 11 | 12 | 13 | 14 | 15 | Longitude | 94.36422 | 94.36182 | 94.3538 | 94.35416 | 94.36628 | Latitude | 40.11244 | 40.0959 | 40.09527 | 40.09735 | 40.11672 | Sample number | 16 | 17 | 18 | 19 | 20 | Longitude | 94.37871 | 94.35798 | 94.3797 | 94.37064 | 94.36068 | Latitude | 40.11257 | 40.10956 | 40.09297 | 40.09979 | 40.11481 | Sample number | 21 | 22 | 23 | 24 | 25 | Longitude | 94.37714 | 94.37607 | 94.37491 | 94.37724 | 94.35638 | Latitude | 40.10784 | 40.11427 | 40.08861 | 40.10723 | 40.11746 |
|
Table 7. Longitude and latitude coordinates of 25 simulated annealing sampling points in 3 km new site