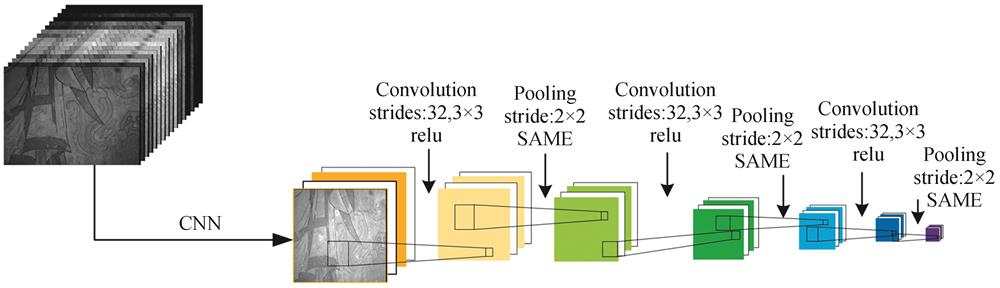
Fig. 1. Spatial feature extraction network structure
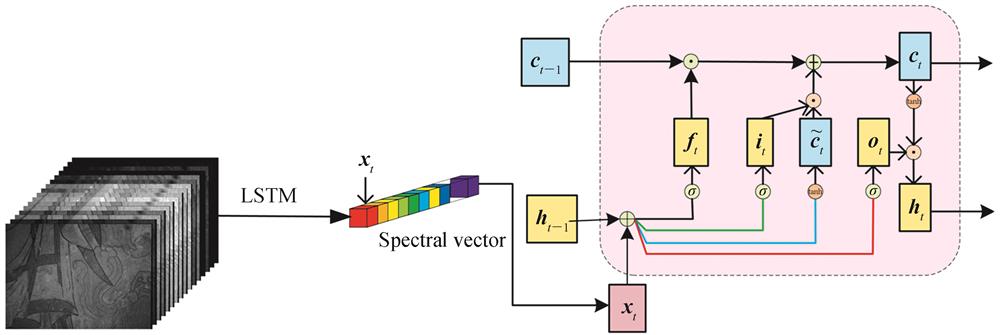
Fig. 2. Spectrum feature extraction network structure
Fig. 3. Space-spectrum joint feature extraction network
Fig. 4. Multispectral pigment board
Fig. 5. Self-made mock murals
Fig. 6. The training results of different methods under the paint board
Fig. 7. Color board classification results
Fig. 8. Classification results of different methods under self-made murals
Fig. 9. Self-made mural classification results
Fig. 10. 16-channel multispectral image of Venerable Injanta's skirt
Fig. 11. Partial region samples and classification results of skirts
Class number | Class name | Training | Test |
---|
Total | 3 496 | 31 383 | 1 | Chrome yellow | 246 | 2 214 | 2 | Orpiment | 248 | 2 232 | 3 | Garcinia | 257 | 2 313 | 4 | Head green | 251 | 2 259 | 5 | Four green | 249 | 2 160 | 6 | Head cyan | 255 | 2 295 | 7 | Cerulean | 261 | 2 349 | 8 | Four cyan | 264 | 2 376 | 9 | Lazurite | 236 | 2 124 | 10 | Crimson | 251 | 2 259 | 11 | Scarlet | 249 | 2 241 | 12 | Cinnabar | 243 | 2 187 | 13 | Ocher | 247 | 2 223 | 14 | Vermilion | 239 | 2 151 |
|
Table 1. The division of training set and test set of multispectral paint board
Class | LSTM | CNN | SSJF |
---|
Chrome yellow | 97.88 | 99.10 | 99.77 | Orpiment | 97.46 | 98.21 | 98.17 | Garcinia | 96.45 | 98.27 | 97.97 | Head green | 96.37 | 99.34 | 99.56 | Four green | 98.52 | 99.63 | 99.82 | Head cyan | 96.27 | 98.57 | 99.26 | Cerulean | 98.64 | 99.58 | 98.26 | Four cyan | 94.82 | 96.93 | 97.42 | Lazurite | 99.85 | 99.87 | 99.95 | Crimson | 94.57 | 99.25 | 99.94 | Scarlet | 93.59 | 97.24 | 97.42 | Cinnabar | 99.22 | 99.75 | 99.95 | Ocher | 98.25 | 99.37 | 99.82 | Vermilion | 99.81 | 99.58 | 99.81 | OA/% | 97.28 | 98.94 | 98.99 | Kappa×100 | 97.07 | 98.86 | 98.91 |
|
Table 2. Classification accuracy of different methods under pigment board
Level | Absolute measurement scale | Relative measurement scale |
---|
1 | Very good | The best in the group | 2 | Better | Better than the average in the group | 3 | Generally | Average in the group | 4 | Poor | Worse than the average in the group | 5 | Very bad | Worst in the group |
|
Table 3. Comparison of the scales of subjective image evaluation
Algorithm | Result |
---|
MDC | Very bad | SID | Poor | SAM | Generally | SVM | Generally | MSCNN | Better | LSTM | Better | SSJF | Very good |
|
Table 4. Evaluation results of dual stimulation injury classification method
Algorithm | Evaluation index |
---|
RMSE | PSNR | SSIM |
---|
MDC | 39.84 | 16.12 | 0.768 8 | SID | 28.11 | 19.15 | 0.887 1 | SAM | 22.49 | 19.15 | 0.894 4 | SVM | 30.93 | 18.32 | 0.864 2 | MSCNN | 27.81 | 19.25 | 0.833 9 | LSTM | 19.82 | 22.19 | 0.880 2 | SSJF | 2.84 | 39.06 | 0.987 4 |
|
Table 5. Objective evaluation results of image quality
Class | MDC | SID | SAM | SVM | LSTM | CNN | SSJF |
---|
Vermilion | 92.23 | 93.36 | 95.96 | 99.38 | 99.36 | 99.38 | 99.47 | Chrome yellow | 91.37 | 99.92 | 99.91 | 98.97 | 99.86 | 99.94 | 99.97 | Four green | 93.30 | 93.24 | 99.61 | 98.87 | 97.63 | 92.88 | 100.00 | Three green | 88.53 | 98.70 | 99.85 | 73.42 | 91.70 | 93.89 | 99.92 | Lazurite | 82.50 | 94.64 | 90.01 | 98.28 | 99.23 | 99.63 | 99.97 | Head green | 40.95 | 66.38 | 70.34 | 97.59 | 95.99 | 98.18 | 99.78 | OA/% | 69.36 | 97.75 | 97.54 | 98.41 | 98.55 | 98.68 | 99.97 | Kappa×100 | 46.92 | 94.45 | 93.96 | 97.47 | 97.52 | 97.74 | 99.95 |
|
Table 6. Classification accuracy of self-made simulated murals by different methods