
Ming-rui ZHOU, Jiang-bei QU, Peng LI, Yi-liang HE. The “Cluster-Regression” COD Prediction Model of Distributed Rural Sewage Based on Three-Dimensional Fluorescence Spectrum and Ultraviolet-Visible Absorption Spectrum[J]. Spectroscopy and Spectral Analysis, 2022, 42(7): 2113
- Spectroscopy and Spectral Analysis
- Vol. 42, Issue 7, 2113 (2022)
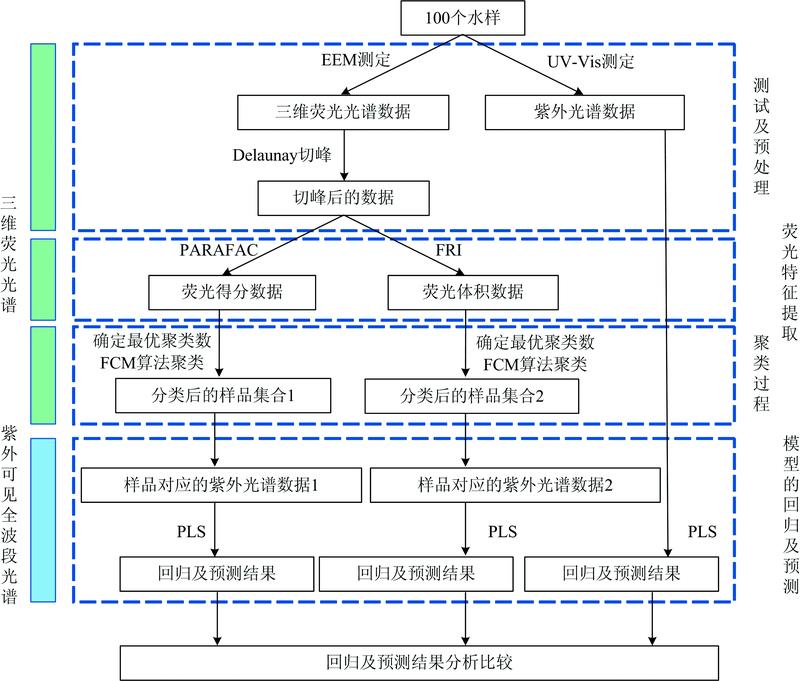
Fig. 1. Flow chart of model design
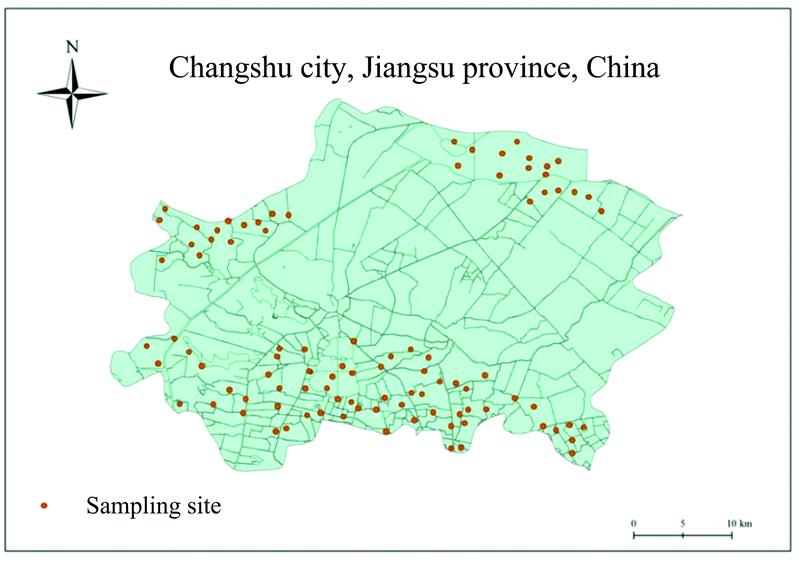
Fig. 2. The map of sampling sites in Changshu
Fig. 3. Three-dimensional map of the regional distribution of fluorescent substances
Fig. 4. Fluorescence spectra of water samples
(a): Three-dimensional fluorescence spectra before removal of scattering;(b) Three-dimensional fluorescence spectra after scattering removal
(a): Three-dimensional fluorescence spectra before removal of scattering;(b) Three-dimensional fluorescence spectra after scattering removal
Fig. 5. PARAFAC of water samples
(a): Leverage analysis of the sample; (b): The split half analysis of emission wavelength with factors of 3; (c): The split half analysis of excitation wavelength with factors of 3
(a): Leverage analysis of the sample; (b): The split half analysis of emission wavelength with factors of 3; (c): The split half analysis of excitation wavelength with factors of 3
Fig. 6. FCM cluster analysis results
(a): Selection of the optimal cluster number after using FRI; (b): Selection of the optimal cluster number after using PARAFAC;(c): Clustering results after using FRI; (d): Clustering results after using PARAFAC
(a): Selection of the optimal cluster number after using FRI; (b): Selection of the optimal cluster number after using PARAFAC;(c): Clustering results after using FRI; (d): Clustering results after using PARAFAC
| |||||||||||||||||||||||||||||||||||||||||
Table 1. Specific clustering results
| ||||||||||||||||||||||||||||||||||||||||||||||||||||||||||||||||||||||||||||||||||||||||||||||||||||||
Table 2. The model fitting and prediction results

Set citation alerts for the article
Please enter your email address
© Copyright 2018-2021 | Chinese Laser Press. All Rights Reserved 沪ICP备15018463号-20