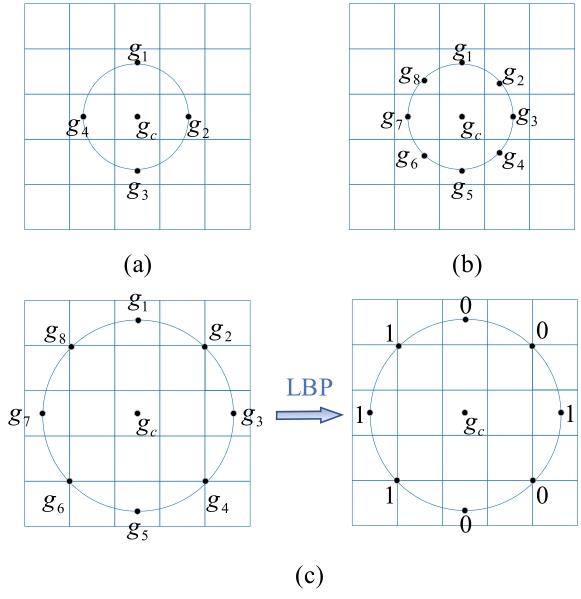
Fig. 1. (a) LBPs=4,r=1,(b) LBPs=8,r=1,(c) schematic diagram of LBP
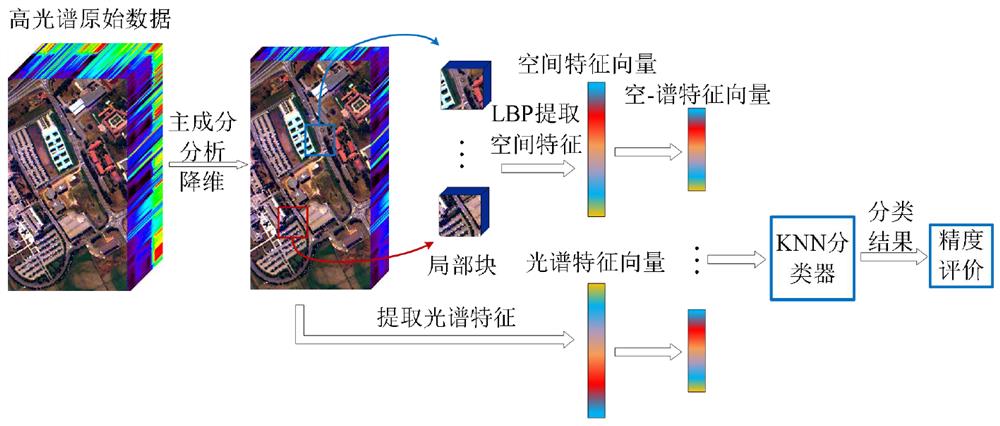
Fig. 2. Flowchart of hyperspectral image classification based on the LBP-SSKNN
Fig. 3. (a)False-color composite image(b)ground-truth classes for the Pavia University scene
Fig. 4. (a)False-color composite image(b) ground truth classes for the Indian Pines scene
Fig. 5. False-color composite image(a) and ground truth classes,(b) for the Salinas scene
Fig. 6. Influence on classification accuracies for the number of principal components
Fig. 7. Influence on classification accuracies of the Indian Pines dataset for r and s
Fig. 8. Influence on classification accuracies of the Indian Pines dataset for k
Fig. 9. Classification maps using the four methods for the Pavia University dataset
Fig. 10. Classification maps using the four methods for the Indian Pines dataset
Fig. 11. Classification maps using the four methods for the Salinas dataset
Fig. 12. Classification accuracies under different training samples for the Pavia University dataset
Fig. 13. Classification accuracies under different training samples for the Indian Pines dataset
Fig. 14. Classification accuracies under different training samples for the Salinas dataset
| 序号 | 地物类别 | 样本量 |
|---|
1 2 3 4 5 6 7 8 9 | Asphalt Meadows Gravel Trees Painted metal sheets Bare Soil Bitumen Self-Blocking Bricks Shadows | 6 631 18 649 2 099 3 064 1 345 5 029 1 330 3 682 947 |
|
Table 1. Sample information of the Pavia University dataset
| 序号 | 地物类别 | 样本量 |
|---|
1 2 3 4 5 6 7 8 9 10 11 12 13 14 15 16 | Alfalfa Corn-notill Corn-mintill Corn Grass-pasture Grass-trees Grass-pasture-mowed Hay-windrowed Oats Soybean-notill Soybean-mintill Soybean-clean Wheat Woods Buildings-Grass-Trees-Drives Stone-Steel-Towers | 46 1 428 830 237 483 730 28 478 20 972 2 455 593 205 1 265 386 93 |
|
Table 2. Sample information for the Indian Pines dataset
| 序号 | 地物类别 | 样本量 |
|---|
1 2 3 4 5 6 7 8 9 10 11 12 13 14 15 16 | Brocoli_green_weeds_1 Brocoli_green_weeds_2 Fallow Fallow_rough_plow Fallow_smooth Stubble Celery Grapes_untrained Soil_vinyard_develop Corn_senesced_green_weeds Lettuce_romaine_4wk Lettuce_romaine_5wk Lettuce_romaine_6wk Lettuce_romaine_7wk Vinyard_untrained Vinyard_vertical_trellis | 2 009 3 426 1 976 1 394 2 678 3 959 3 579 11 271 6 203 3 278 1 068 1 927 916 1 070 7 268 1 807 |
|
Table 3. Sample information for the Salinas dataset
| 主成分个数 | Pavia University | Indian Pines | Salinas |
|---|
| 贡献率/% | 累计贡献率/% | 贡献率/% | 累计贡献率/% | 贡献率/% | 累计贡献率/% |
|---|
1 2 3 4 5 6 7 8 | 58.32 36.10 4.43 0.30 0.21 0.18 0.12 0.07 | 58.32 94.42 98.86 99.16 99.37 99.54 99.67 99.74 | 68.49 23.53 1.49 0.82 0.69 0.52 0.40 0.36 | 68.49 92.02 93.52 94.34 95.03 95.55 95.95 96.31 | 74.47 23.53 1.13 0.54 0.17 0.06 0.02 0.01 | 74.47 98.00 99.14 99.68 99.85 99.91 99.93 99.95 |
|
Table 4. Comparison of principal component contribution for the three datasets
| 分类精度(%) | w=3 | w=5 | w=7 | w=9 | w=11 | w=13 | w=15 |
|---|
| OA | 97.00 ± 0.26 | 97.62 ± 0.36 | 97.72 ± 0.35 | 97.88 ± 0.26 | 97.52 ± 0.29 | 97.85 ± 0.28 | 97.71 ± 0.43 | | AA | 95.06 ± 1.11 | 95.78 ± 1.62 | 95.59 ± 1.19 | 95.59 ± 1.03 | 96.03 ± 1.44 | 95.90 ± 1.41 | 95.80 ± 0.89 | | Kappa | 96.58 ± 0.30 | 97.29 ± 0.41 | 97.40 ± 0.39 | 97.58 ± 0.29 | 97.17 ± 0.30 | 97.55 ± 0.37 | 97.39 ± 0.49 |
|
Table 5. Influence on classification accuracies of the Indian Pines dataset for w
| 序号 | 地物种类 | 训练样本数 | 测试样本数 | KNN | RBF-SVM | KSOMP | LBP-SSKNN |
|---|
| 1 | Asphalt | 663 | 5 968 | 80.22±0.70 | 91.42±0.40 | 87.67±0.56 | 99.90±0.11 | | 2 | Meadows | 1 865 | 16 784 | 99.18±0.09 | 96.54±0.51 | 99.99±0.00 | 99.97±0.03 | | 3 | Gravel | 210 | 1 889 | 64.28±2.37 | 71.52±2.39 | 89.63±3.12 | 99.55±0.33 | | 4 | Trees | 306 | 2 758 | 79.06±0.77 | 92.88±0.50 | 94.04±1.13 | 92.67±1.49 | | 5 | Painted metal sheets | 135 | 1 211 | 99.21±0.27 | 99.52±0.26 | 100.00±0.00 | 99.33±0.33 | | 6 | Bare Soil | 503 | 4 526 | 40.62±1.33 | 75.57±1.68 | 85.62±2.40 | 100.00±0.00 | | 7 | Bitumen | 133 | 1 197 | 79.39±1.51 | 80.07±1.55 | 89.49±1.09 | 99.89±0.15 | | 8 | Self-Blocking Bricks | 368 | 3 314 | 83.84±2.01 | 86.06±1.24 | 94.78±0.77 | 99.48±0.62 | | 9 | Shadows | 95 | 852 | 92.96±0.86 | 97.52±1.31 | 73.95±0.44 | 90.63±1.29 | | OA | | | | 84.13±0.32 | 90.49±0.19 | 94.11±0.38 | 99.15±0.15 | | AA | | | | 79.86±0.40 | 87.90±0.45 | 90.57±0.41 | 97.94±0.27 | | Kappa | | | | 78.24±0.46 | 87.30±0.26 | 92.08±0.52 | 98.87±0.20 |
|
Table 6. Classification accuracies using the four methods based on the Pavia University dataset
| 序号 | 地物种类 | 训练样本数 | 测试样本数 | KNN | RBF-SVM | KSOMP | LBP-SSKNN |
|---|
| 1 | Alfalfa | 5 | 41 | 24.88±10.22 | 17.32±14.69 | 86.77±7.11 | 93.41±4.32 | | 2 | Corn-notill | 143 | 1 285 | 59.64±4.23 | 75.61±2.16 | 88.44±1.72 | 97.95±0.41 | | 3 | Corn-mintill | 83 | 747 | 45.02±2.68 | 69.97±2.56 | 90.80±3.08 | 96.28±1.51 | | 4 | Corn | 24 | 213 | 24.88±8.06 | 46.95±6.17 | 91.74±4.19 | 95.45±2.17 | | 5 | Grass-pasture | 48 | 435 | 80.74±1.91 | 90.69±2.29 | 93.70±0.10 | 97.52±0.77 | | 6 | Grass-trees | 73 | 657 | 97.35±1.57 | 95.25±1.44 | 99.06±0.39 | 97.84±1.58 | | 7 | Grass-pasture-mowed | 3 | 25 | 66.40±9.12 | 21.20±15.02 | 47.29±9.01 | 94.00±4.73 | | 8 | Hay-windrowed | 48 | 430 | 97.28±2.15 | 99.14±0.57 | 99.95±0.09 | 99.60±0.56 | | 9 | Oats | 2 | 18 | 16.60±5.00 | 6.11±0.38 | 0.00±0.00 | 78.33±1.78 | | 10 | Soybean-notill | 97 | 975 | 68.61±3.06 | 69.51±3.05 | 89.65±3.16 | 96.88±1.48 | | 11 | Soybean-mintill | 246 | 2 209 | 73.13±1.94 | 86.52±1.03 | 96.54±0.78 | 98.90±0.49 | | 12 | Soybean-clean | 59 | 534 | 27.08±4.68 | 71.89±4.92 | 93.61±2.39 | 96.72±1.51 | | 13 | Wheat | 21 | 184 | 91.74±2.02 | 96.79±1.51 | 99.51±0.45 | 95.82±2.98 | | 14 | Woods | 127 | 1 138 | 93.50±0.72 | 96.78±1.36 | 99.32±0.57 | 99.09±0.37 | | 15 | Buildings-Grass-Trees-Drives | 39 | 347 | 15.53±1.86 | 52.62±4.44 | 87.92±7.58 | 98.96±0.61 | | 16 | Stone-Steel-Towers | 9 | 84 | 83.93±2.08 | 88.81±4.03 | 97.63±1.30 | 92.74±4.90 | | OA | | | | 68.42±0.60 | 81.27±0.56 | 93.94±0.46 | 97.88±0.26 | | AA | | | | 59.46±1.20 | 67.82±0.92 | 85.19±0.60 | 95.60±1.03 | | Kappa | | | | 63.71±0.71 | 78.48±0.66 | 93.08±0.53 | 97.58±0.29 |
|
Table 7. Classification accuracies using the four methods for the Indian Pines dataset
| 序号 | 地物种类 | 训练样本数 | 测试样本数 | KNN | RBF-SVM | KSOMP | LBP-SSKNN |
|---|
| 1 | Brocoli_green_weeds_1 | 40 | 1 969 | 97.17±0.48 | 98.60±1.15 | 99.91±0.12 | 99.81±0.32 | | 2 | Brocoli_green_weeds_2 | 69 | 3 357 | 98.22±0.33 | 99.01±0.38 | 99.97±0.06 | 99.96±0.05 | | 3 | Fallow | 40 | 1 936 | 93.39±2.08 | 93.63±3.52 | 96.99±1.76 | 99.91±0.12 | | 4 | Fallow_rough_plow | 28 | 1 366 | 98.87±0.11 | 98.59±0.83 | 99.45±0.34 | 93.11±2.17 | | 5 | Fallow_smooth | 54 | 2 624 | 94.55±1.32 | 97.74±1.05 | 98.29±1.27 | 94.65±1.47 | | 6 | Stubble | 79 | 3 880 | 99.52±0.09 | 99.44±0.23 | 100.00±0.00 | 97.32±0.95 | | 7 | Celery | 72 | 3 507 | 99.21±0.08 | 99.35±0.25 | 99.05±0.42 | 98.56±0.75 | | 8 | Grapes_untrained | 225 | 11 046 | 82.36±2.14 | 87.44±1.17 | 95.08±1.15 | 99.79±0.17 | | 9 | Soil_vinyard_develop | 124 | 6 079 | 97.27±0.19 | 98.64±0.63 | 99.97±0.32 | 99.99±0.03 | | 10 | Corn_senesced_green_weeds | 66 | 3 212 | 84.14±2.27 | 92.68±1.76 | 96.77±0.83 | 98.69±0.52 | | 11 | Lettuce_romaine_4wk | 21 | 1 047 | 92.00±2.00 | 94.16±4.44 | 94.29±6.79 | 95.57±4.24 | | 12 | Lettuce_romaine_5wk | 39 | 1 888 | 99.99±0.02 | 99.55±0.49 | 99.99±0.02 | 96.72±1.18 | | 13 | Lettuce_romaine_6wk | 18 | 898 | 97.76±0.28 | 97.08±2.08 | 98.87±0.61 | 92.49±2.90 | | 14 | Lettuce_romaine_7wk | 21 | 1 049 | 88.52±2.58 | 92.83±2.44 | 99.42±0.29 | 91.04±4.60 | | 15 | Vinyard_untrained | 145 | 7 123 | 53.64±2.80 | 67.78±2.70 | 84.44±3.40 | 98.81±0.43 | | 16 | Vinyard_vertical_trellis | 36 | 1 771 | 84.11±3.12 | 96.35±1.62 | 99.09±0.52 | 99.99±0.02 | | OA | | | | 87.02±0.26 | 91.43±0.39 | 96.23±0.40 | 98.46±0.15 | | AA | | | | 91.30±0.40 | 94.56±0.40 | 97.60±0.38 | 97.28±0.21 | | Kappa | | | | 85.51±0.29 | 90.44±0.44 | 95.81±0.45 | 98.29±0.17 |
|
Table 8. Classification accuracies using the four methods for the Salinas dataset