
Xiang Liu, Aiying Yang, Yu Wang, Lihui Feng. Combination of light-emitting diode positioning identification and time-division multiplexing scheme for indoor location-based service[J]. Chinese Optics Letters, 2015, 13(12): 120601
- Chinese Optics Letters
- Vol. 13, Issue 12, 120601 (2015)
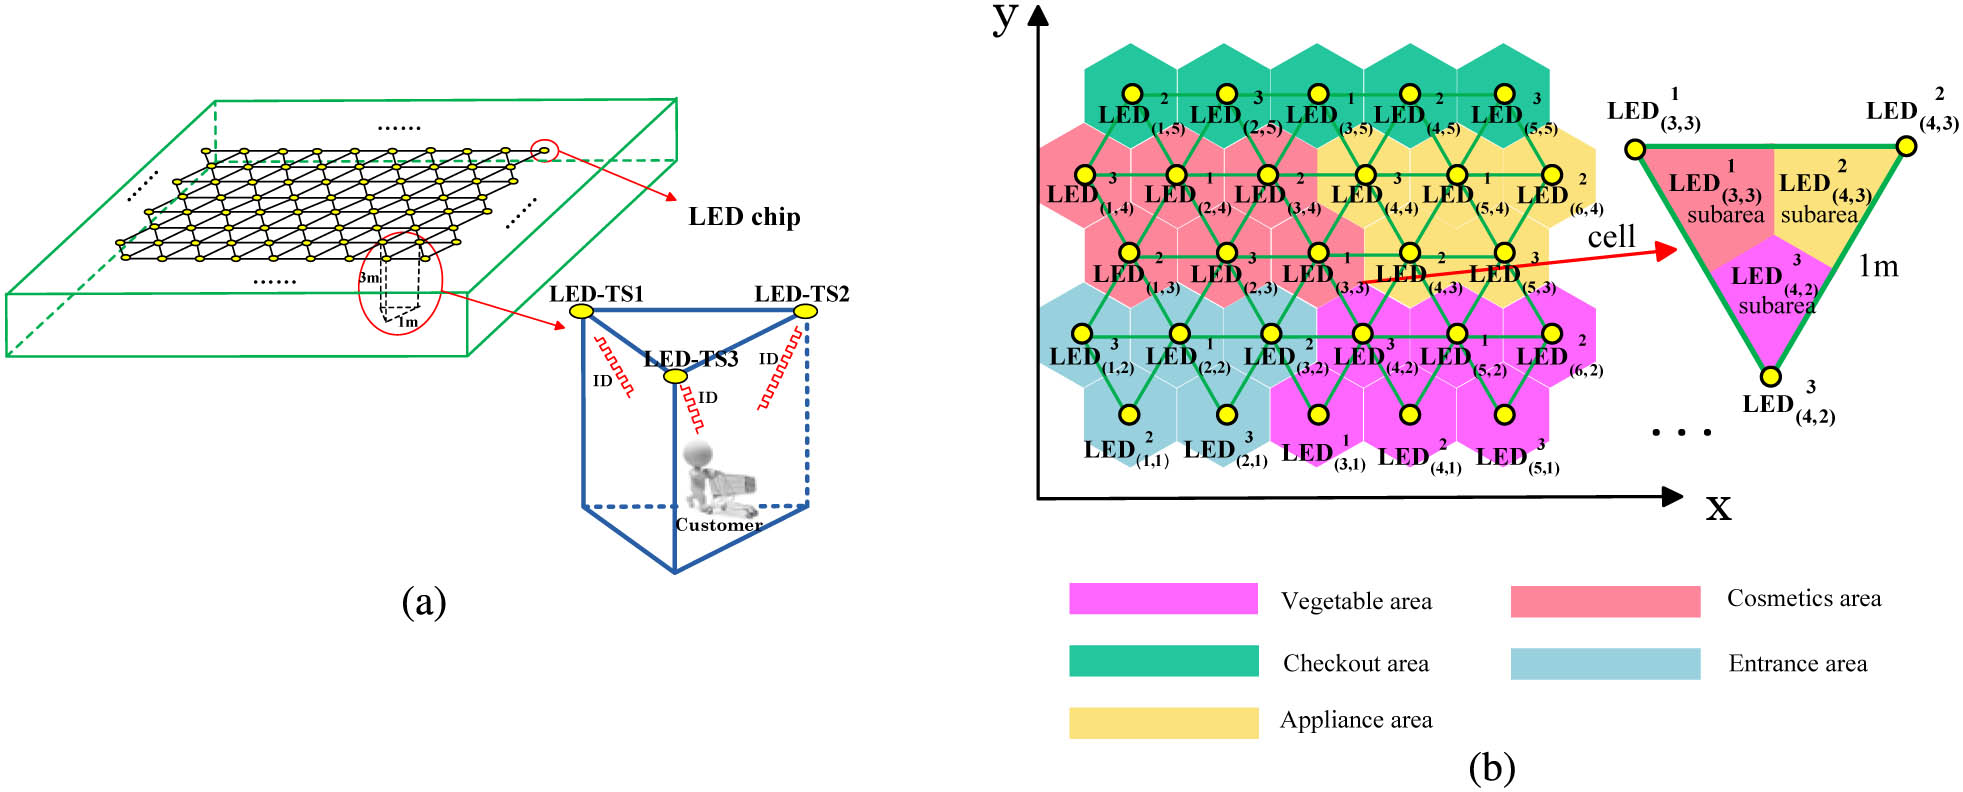
Fig. 1. (a) Arrangement of LED lamps in an indoor environment. (b) LED ID-based positioning scheme for the scenario of a supermarket.
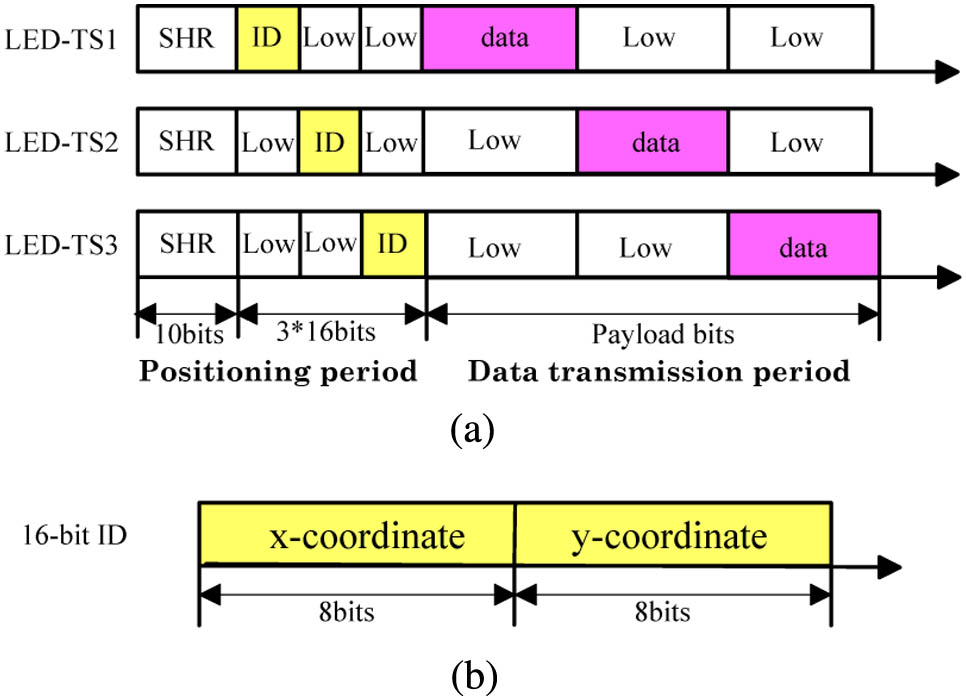
Fig. 2. (a) The structure of the data frame. (b) The ID coordinates of the lamp.
Fig. 3. The rectangular coordinates of 7 LED lamps in a cellular structure.
Fig. 4. (a) The illuminance distribution of 7 LED lamps and (b) the central area.
Fig. 5. (a) The bird’s eye view of the illuminance distribution of 7 LED lamps occupying TS1. (b) Illuminance distribution around the center point under an individual LED.
Fig. 6. (a) Arrangement of 3 LEDs in the experiment. (b) The experimental system.
Fig. 7. Received waveform when PD is at the subareas of (a) 1-1 and (b) 1-2 as in Fig. 6(a) .
Fig. 8. (a) Received eye diagram of payload data. (b) BER vs distance from the distribution center of an LED.
Fig. 9. Accumulative probability of the positioning error distribution.
|
Table 1. Positioning Bits Transmitted by LED(3,3)1, LED(4,3)2, and LED(4,2)3
|
Table 2. Parameters of LEDs Used
|
Table 3. Measured Voltage Amplitude and Estimated Position

Set citation alerts for the article
Please enter your email address
© Copyright 2018-2021 | Chinese Laser Press. All Rights Reserved 沪ICP备15018463号-20