A combination of light-emitting diode (LED) identification and a time-division multiplexing scheme is proposed in this Letter for indoor location-based service. With the scheme, the arrangement of white LED lamps and the structure of a data frame are designed to realize high-accuracy indoor positioning and location-based payload data transmission simultaneously. The results of the experiment demonstrate that the indoor positioning accuracy is 10 cm and 2 Mb/s data transmission with high signal quality is realized.
Location-based service (LBS) techniques mainly include global positioning systems (GPS), wireless local area networks (WLAN), ZigBee, radio frequency identification (RFID), bluetooth, ultra wideband (UWB), etc[1]. However, GPS cannot be used in an indoor environment[2]. WLAN, RFID, ZigBee, bluetooth, and the UWB location system are limited due to electromagnetic interference, noise, stability, cost, and other factors[3]. With the great development of the light-emitting diode (LED) as a light source, visible light communication (VLC) technology based on LEDs has been extensively researched in recent years[4–6]. Due to its high transmission speed, VLC will be a good candidate for future wireless communications and lighting in indoor environments simultaneously. The LBS technology based on VLC is a kind of green service, and attracts much attention[7,8]. Jung et al. developed 4-bit LED identification (ID) and defined correlated sum ratios to realize the point positioning in a dimension of [9]. But for a large dimension, like a supermarket or library, the point positioning will be tremendous. In this Letter, a scheme combining LED-positioning ID and time-division multiplexing is proposed to locate the customer and transmit the payload data in a large-dimension indoor environment of . A data frame, including a 10-bit synchronous header, 16-bit LED positioning bits, and payload data, is designed. By measuring the optical power during the positioning time slots, the customer can be located in different areas, such as the food area, checkout area, electronics area, and so on in a supermarket. Then, content-targeted data, like deals, promotions, and product information and reviews, are delivered to the customers based on their positions. The experiment demonstrates that positioning with a high accuracy of 10 cm and data transmission can be realized in a supermarket environment.
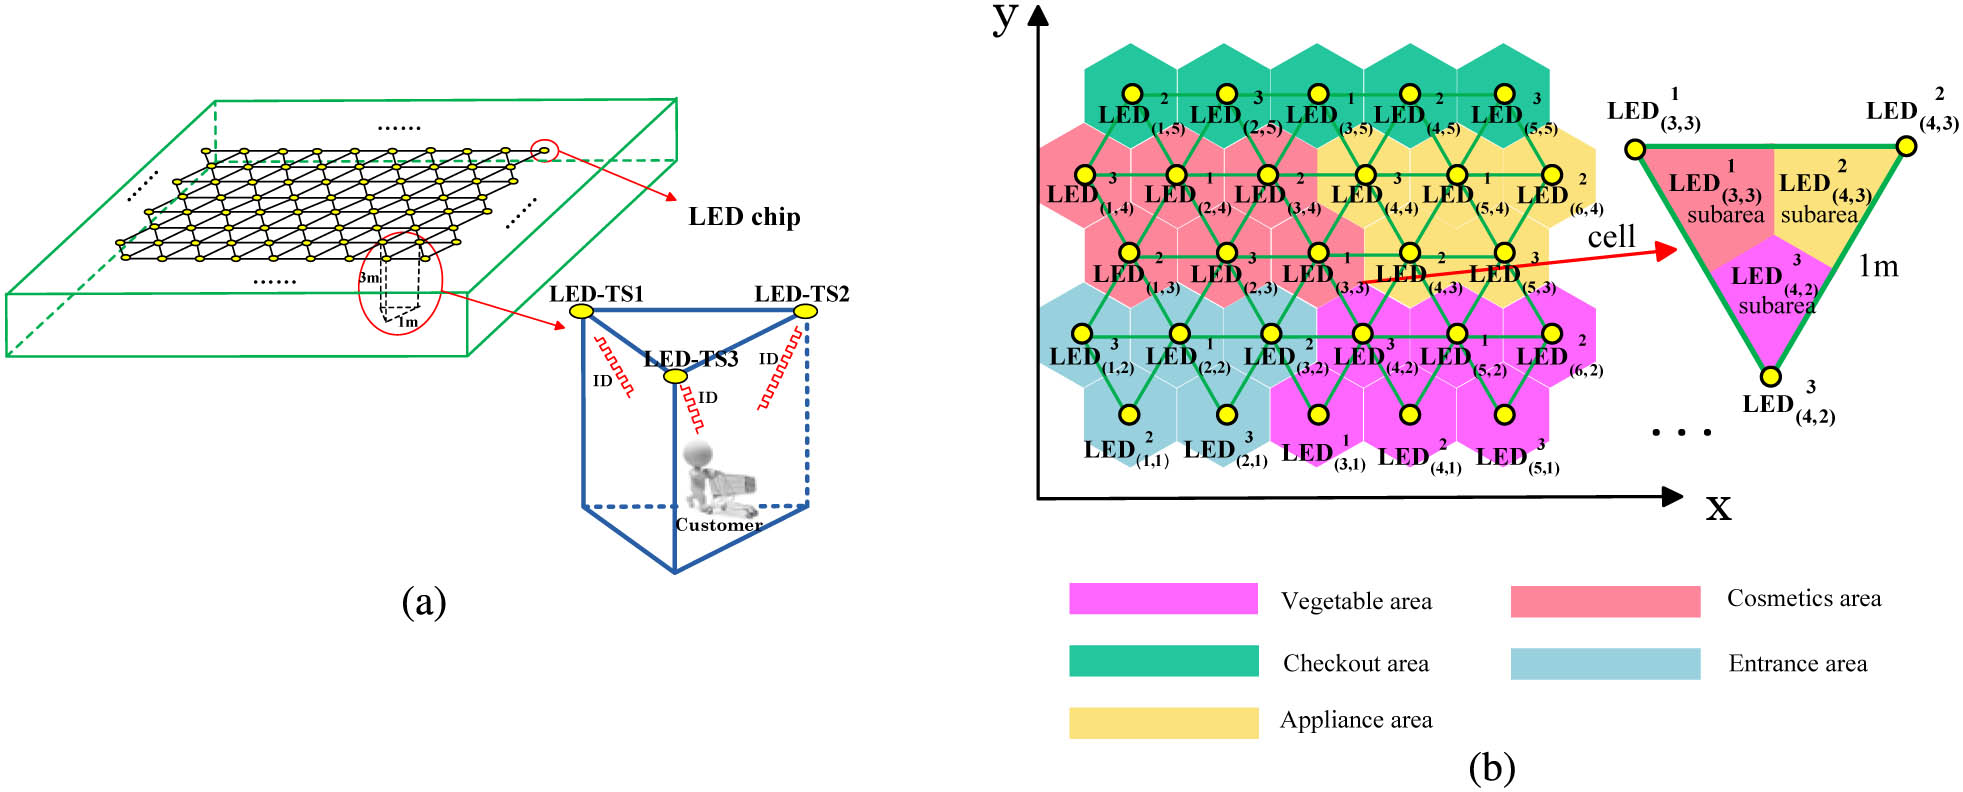
A large-dimension indoor environment, like a supermarket or a library, with dimensions of about is considered in this Letter. As shown in Fig. 1(a), the room is divided into equilateral triangle cells with a side length of 1 m. Three white LED lamps are mounted on the ceiling of each cell. As an example, the supermarket is divided into several functional areas marked as different colors in Fig. 1(b). In order to identify the area that the customer is in and overcome the interference from the neighboring LED lamps in a cell, the scheme of assigning a specific positioning ID and time slot to each LED lamp is proposed. In Fig. 1(b), specific coordinates marking the geographical position and time slot are assigned to each LED lamp. Thus, the individual LED lamp in the supermarket is denoted as , and the lower index is the coordinates and the upper index is the time slot assigned to an LED lamp. Correspondingly, the data frame transmitted from LED lamps should be designed in such a way that the position of the customer can be identified.
Figure 1.(a) Arrangement of LED lamps in an indoor environment. (b) LED ID-based positioning scheme for the scenario of a supermarket.
As shown in Fig. 2(a), at the LED transmitter, there is a fixed-length data frame that consists of three parts: the synchronization header, positioning ID bits, and payload data. The synchronization header enables the receiver to synchronize the received frames. A 10-bit synchronization header is used to synchronize the data frames. The positioning ID bits are used to decide which area the customer is in and at which time slot the customer should receive the payload data. In principle, the length of each part depends on the number of LED lamps used in the indoor environment and the expected data rate. If a supermarket with dimensions of is considered, the coordinates of an LED lamp can be represented by a 16-bit positioning ID as shown in Fig. 2(b), with the first 8-bit representing the coordinate and the second 8-bit representing the coordinate. Each LED lamp transmits data during the time slot it occupies, i.e., the individual LED lamp transmits its own data depending on the area it locates and the assigned time slot. Three 16-bit positioning IDs correspond to three time slots (TS1, TS2, and TS3) that the neighboring LED lamps in a cell occupy. Thus, 48 positioning bits are transmitted for the receiver to decide which area the customer is in and in which time slot the customer receives the payload data. For example, the circle-marked cell in Fig. 1(a) is composed of 3 LED lamps: , , and . transmits its 16-bit positioning ID as 00000011 00000011 in the first time slot (TS1), and its 48 positioning bits are 0000001100000011, 0000000000000000, and 0000000000000000. Similarly, the 48 positioning bits for and are shown in Table 1. In Fig. 1(b), corresponds to the cosmetics area, so it transmits payload data about cosmetics (deals, promotions, product info or reviews on cosmetics), and and transmit payload data about appliances and vegetables, respectively, according to the areas they locate.
Sign up for Chinese Optics Letters TOC. Get the latest issue of Chinese Optics Letters delivered right to you!Sign up now
LED Lamp
Time Slot
16-bit ID
LED(3,3)1
TS1
00000011 00000011
TS2
00000000 00000000
TS3
00000000 00000000
LED(4,3)2
TS1
00000000 00000000
TS2
00000100 00000011
TS3
00000000 00000000
LED(4,2)3
TS1
00000000 00000000
TS2
00000000 00000000
TS3
00000100 00000010
Table 1. Positioning Bits Transmitted by LED(3,3)1, LED(4,3)2, and LED(4,2)3
At the customer’s end, when the positioning bits are decided by the received optical signal as 00000011 00000011, 00000100 00000011, and 00000100 00000010, the customer can be located in the cell composed of , and . To enhance the positioning precision, as shown in Fig. 1(b), the cell is further divided into 3 sub-areas, defined as sub-area, sub-area, and sub-area. According to the maximum optical power of , , and received in the three time slots transmitted by , , and , respectively, the customer can be located in one of the three sub-areas. Once the customer is located in a sub-area, the corresponding receiver end will only process the data transmitted by the nearest lamp, and the data from the other lamps are discarded. For example, when a customer is located in sub-area, the receiver will only processes data during TS1 transmitted by , while the data in TS2 and TS3 are regarded as invalid data. With this scheme, the LBS can be realized. It should be pointed out that, when the receiver is on the mid-point of two neighboring LED lamps in a cell or the center point of a cell, the payload data from two or three neighboring LED lamps will be received at three time slots in sequence. In this case, the customer can choose which area he will go into.
The arrangement of LED lamps for indoor positioning should first satisfy the requirement of indoor lighting, and the illuminance distribution on the plane of 1 m, i.e., the general reference surface height above the ground should be researched. Considering the interference from neighboring LED lamps, the illuminance distribution of 7 LED lamps in a cellular structure, as shown in Fig. 3, is analyzed. The rectangular coordinates are established with the original point is at its center. For simplicity, the reflection from the walls and floor is ignored. The radiation of the LEDs follows a Lambertian radiation pattern. The channel gain is expressed as[10]where is the angle of irradiance, is the distance between the transmitter and receiver, is the photo-detector area, and is the angle of incidence relative to the normal direction. To define as the LED view angle at half power, the order is expressed by .
Figure 3.The rectangular coordinates of 7 LED lamps in a cellular structure.
To substitute the illuminance equation into Eq. (1) yields where is the number of LED lamps. All LED lamps have an identical luminous flux .
In the positioning period, 16-bit IDs are employed by the customer’s end to determine the area the customer is in. However, positioning bits transmitted by the neighboring lamps may interfere at the central area during TS1, TS2, or TS3. It is not hard to understand that the interference is weaker with the decreasing LED view angle at half power . We select as a tradeoff between the lighting requirement and interference. The power of the LED lamp is set to 5 W and luminous efficiency is 50 lm/W, so . Figure 4(a) is the illuminance distribution on the reference plane of 7 neighboring LED lamps in the cellular structure shown by Fig. 3. The illuminance distribution at the central area under an LED is shown in Fig. 4(b). The average and minimum illuminances of the central area are 505.34 and 475.98 lx, respectively. The maintained illuminance (, lx) for a large sales area should be 500 lx[11]; thus, the illuminance distribution on the reference plane satisfies the indoor lighting standard.
Figure 4.(a) The illuminance distribution of 7 LED lamps and (b) the central area.
As described above, the neighboring LED lamps in a cell transmit data in different time slots; thus, the interference from neighboring LED lamps occupying different time slots can be discarded. But the interference from LED lamps occupying the same time slot should be considered. Take 7 neighboring LED lamps occupying TS1, for example: Fig. 5(a) shows a bird’s eye view of the illuminance distribution. Figure 5(b) is the illuminance distribution at the central area under an LED. The illuminance at 0.5 m from the center is 1/3 of the central maximum illuminance, 1/10 at 0.8 m, and will decreased to 1/70 at 1.0 m. Thus, the interference between two neighboring LED lamps occupying the same time slot is negligible, since the distance between them is .
Figure 5.(a) The bird’s eye view of the illuminance distribution of 7 LED lamps occupying TS1. (b) Illuminance distribution around the center point under an individual LED.
In the proof of concept experiment, a cell consisting of , , and is built up to verify the scheme proposed in this Letter. The arrangement of three LEDs is shown in Fig. 6(a). The experimental parameters are listed in Table 2. The side length and height of the cell are 1.0 and 3.0 m, respectively, and the receiver plane is 0.8 m above the ground. At the transmitter, three LEDs are driven by an field-programmable gate array (FPGA) (EP2C8Q208C8), and the payload data (image) rate is 2 Mb/s. The data frame transmitted from the LED is modulated in the on–off keying format. The photon-detector (PD) provided by THORLABS (PDA10A) has the active area of , and is placed on the receiver plane to detect the optical signal. Following the PD, a signal processing circuit is used to remove the DC component of the detected signal, convert the remained signal to a digital signal by an analog-to-digital converter, and finally process the digital signal by another FPGA and a client host computer to locate the position of the PD. Figure 6(b) is the experimental system; a ZigBee terminal and a ZigBee coordinator are used to communicate with thehost PC and the server PC to report the customer’s position to the sever PC or transmit a command to the host PC.
The received optical power , , and from the three LED lamps can be calculated by , where is the voltage responsivity of a receiver and is the measured voltage amplitude. Thus, the position of the receiver can be located according to the received waveform during the positioning period. Figures 7(a) and 7(b) show the measured waveforms at the receiver. According to the waveform during the positioning period, the position of the PD can be decided. It can be seen in Fig. 7(a) that there is data signal in the first time slot (TS1), and the positioning ID is 0000000011 00000011. Thus, it can be decided that the PD is at the point of 1–1. In Fig. 7(b), there is low-intensity signal in TS2 and TS3, and it is not hard to decide that the PD is at the sub-area of 1-2. The measured voltage amplitudes at the typical positions and the corresponding estimated positions are listed in Table 3. The results indicate that the customer can be located in the sub-area that he is in.
Practical Position
V1(a.u.)
V2(a.u.)
V3(a.u.)
Estimated Position
1–1
0.82
0
0
LED(3,3)1 sub-area
1–2
0.81
0.25
0.25
LED(3,3)1 sub-area
2–1
0
0.83
0
LED(4,3)2 sub-area
2–2
0.25
0.81
0.24
LED(4,3)2 sub-area
3–1
0
0
0.81
LED(4,2)3 sub-area
3–2
0.24
0.25
0.80
LED(4,2)3 sub-area
A
0.82
0.82
0.01
A
B
0.01
0.82
0.81
B
C
0.81
0.02
0.80
C
O
0.82
0.81
0.81
O
Table 3. Measured Voltage Amplitude and Estimated Position
Once the customer is located in a sub-area, the payload data transmitted by the nearest LED lamp (i.e., specific time slot) will be kept, and the payload data in the other time slot is regarded as the interference from neighboring LED lamps and discarded. For example, when the PD is located in sub-area 1–2, only the payload data transmitted by is transmitted. With the PD at the distribution center of , Fig. 8(a) shows the received eye diagram of the payload data it transmits, where the factor is 6.85, and the bit error rate (BER) is less than . To define as the distance from the center point of an LED distribution at the receiver plane, Fig. 8(b) shows that the BER will increase when the PD moves off the center.
Figure 8.(a) Received eye diagram of payload data. (b) BER vs distance from the distribution center of an LED.
When the customer is located in a sub-area, his specific position in the sub-area can be determined by a received signal strength algorithm. Figure 9 is the accumulative probability of the positioning error distribution, and the maximum positioning error is about 10 cm, i.e., the positioning accuracy is 10 cm.
Figure 9.Accumulative probability of the positioning error distribution.
Indoor LBS for a large-dimension environment by utilizing visible light communication technology is researched in this Letter. A scheme exploiting LED positioning ID and time-division multiplexing is proposed to locate the customer’s position in an indoor environment. The arrangement of LED lamps and the design of the data frame are investigated to realize both positioning and data transmission. The experiment demonstrates that with an LED of 5 W, the customer’s positioning with accuracy of 10 cm and 2 Mb/s payload image data transmission can be simultaneously realized. If an LED with a wider bandwidth is employed, the transmission data rate can be promoted. The positioning scheme we propose in this Letter can be used in many indoor environments, like supermarkets, museums, libraries, hospitals, and so on.