Author Affiliations
School of Communication and Information Engineering, Xi'an University of Posts & Telecommunications, Xi'an , Shaanxi 710121, Chinashow less
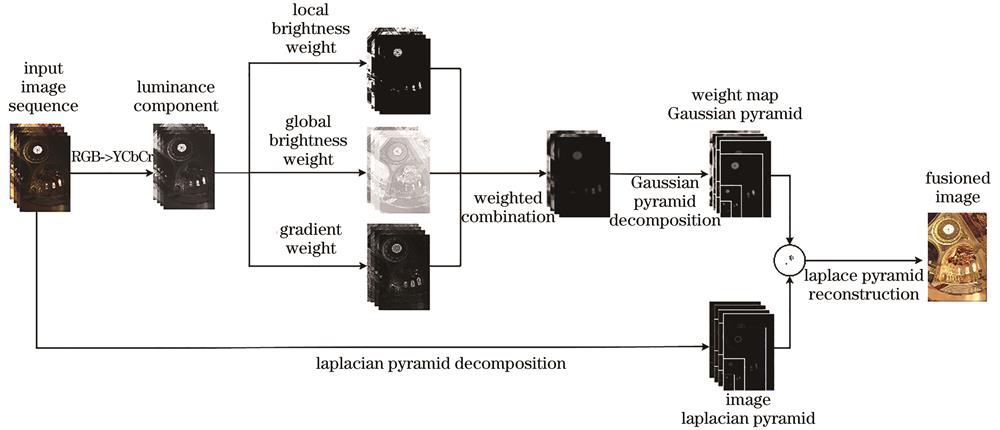
Fig. 1. Flow chart of multiexposure fusion method based on full sequence feature weight of image
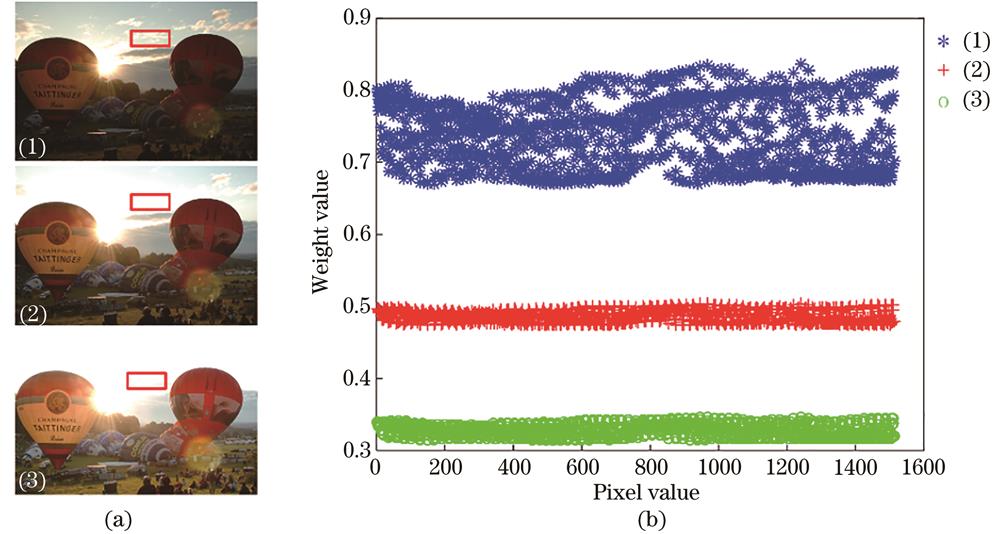
Fig. 2. Comparison of local brightness weight between well exposed image and overexposed image. (a) Input images; (b) local brightness weight of rectangular box area
Fig. 3. Weight comparison
Fig. 4. Process of obtaining global brightness weight. (a) Luminance maps; (b) average brightness maps of image sequence; (c) distance maps; (d) global brightness weights
Fig. 5. Comparison between Canny local gradient and proposed gradient weight. (a) Canny local gradient; (b) proposed gradient weight
Fig. 6. Results of Tower multiexposure image sequence. (a) Input image sequence; (b) local brightness weight; (c) global brightness weight; (d) gradient weight; (e) final weight; (f) fusion image
Fig. 7. Results of Venice multiexposure image sequence. (a) Input image sequence; (b) local brightness weight; (c) global brightness weight; (d) gradient weight; (e) final weight; (f) fusion image
Fig. 8. Fusion results of different algorithms. (a)‒(e) Algorithms in references [16], [14], [18], [12], [11]; (f) proposed algorithm
Fig. 9. Local enlarged images of fusion result. (a)‒(e) Algorithms in references [16], [14], [18], [12], [11]; (f) proposed algorithm
Fig. 10. Influence of weight on cave image quality.(a) Fusion image based on ; (b) fusion image based on ; (c) fusion image based on
Image sequence | [26] 2012 | [27] 2011 | [20] 2012 | [21] 2013 | [16] 2009 | [14] 2015 | [18] 2018 | [12] 2020 | [11] 2020 | Proposed algorithm |
---|
Average | 0.91 | 0.931 | 0.945 | 0.965 | 0.977 | 0.974 | 0.978 | 0.943 | 0.882 | 0.980 | Balloons | 0.913 | 0.918 | 0.941 | 0.948 | 0.963 | 0.969 | 0.971 | 0.912 | 0.899 | 0.972 | Cave | 0.934 | 0.918 | 0.923 | 0.978 | 0.980 | 0.975 | 0.977 | 0.946 | 0.932 | 0.982 | Chinese garden | 0.927 | 0.967 | 0.951 | 0.984 | 0.988 | 0.989 | 0.990 | 0.990 | 0.861 | 0.99 | Farmhouse | 0.932 | 0.947 | 0.959 | 0.985 | 0.983 | 0.981 | 0.978 | 0.983 | 0.93 | 0.983 | Lamp | 0.871 | 0.829 | 0.933 | 0.934 | 0.945 | 0.94 | 0.954 | 0.824 | 0.886 | 0.955 | Landscape | 0.941 | 0.944 | 0.948 | 0.942 | 0.991 | 0.976 | 0.981 | 0.991 | 0.835 | 0.984 | Madison | 0.864 | 0.945 | 0.949 | 0.968 | 0.974 | 0.977 | 0.978 | 0.949 | 0.929 | 0.982 | Office | 0.900 | 0.961 | 0.954 | 0.967 | 0.986 | 0.985 | 0.989 | 0.982 | 0.886 | 0.991 | Tower | 0.932 | 0.939 | 0.950 | 0.986 | 0.981 | 0.986 | 0.987 | 0.988 | 0.900 | 0.985 | Venice | 0.889 | 0.942 | 0.937 | 0.954 | 0.978 | 0.966 | 0.973 | 0.864 | 0.767 | 0.976 |
|
Table 1. MEF-SSIM scores of different algorithms
Image sequence | [16] 2009 | [14] 2015 | [18] 2018 | [12] 2020 | [11] 2020 | Proposed algorithm |
---|
Average | 7.482 | 7.588 | 7.649 | 7.622 | 7.634 | 7.652 | Balloons | 7.596 | 7.517 | 7.840 | 7.635 | 7.388 | 7.838 | Cave | 7.101 | 7.580 | 7.579 | 7.664 | 7.377 | 7.599 | Chinese garden | 7.825 | 7.777 | 7.751 | 7.745 | 7.855 | 7.776 | Farmhouse | 7.317 | 7.240 | 7.397 | 7.451 | 7.535 | 7.358 | Lamp | 7.372 | 7.345 | 7.724 | 7.787 | 7.728 | 7.758 | Landscape | 7.395 | 7.634 | 7.442 | 7.341 | 7.489 | 7.426 | Madison | 7.782 | 7.750 | 7.793 | 7.838 | 7.730 | 7.779 | Office | 7.320 | 7.546 | 7.526 | 7.463 | 7.677 | 7.525 | Tower | 7.582 | 7.573 | 7.634 | 7.644 | 7.783 | 7.686 | Venice | 7.531 | 7.916 | 7.805 | 7.650 | 7.775 | 7.776 |
|
Table 2. Average information entropy of fusion results of different algorithms
Image sequence | W1 | W2 | W3 | W1W2 | W1W2W3 |
---|
Average | 0.973 | 0.874 | 0.953 | 0.975 | 0.980 | Balloons | 0.970 | 0.964 | 0.935 | 0.971 | 0.972 | Cave | 0.951 | 0.674 | 0.952 | 0.962 | 0.982 | Chinese garden | 0.988 | 0.915 | 0.965 | 0.987 | 0.990 | Farmhouse | 0.980 | 0.877 | 0.969 | 0.981 | 0.983 | Lamp | 0.951 | 0.866 | 0.931 | 0.951 | 0.955 | Landscape | 0.983 | 0.956 | 0.961 | 0.983 | 0.984 | Madison | 0.981 | 0.776 | 0.943 | 0.982 | 0.982 | Office | 0.989 | 0.917 | 0.947 | 0.990 | 0.991 | Tower | 0.968 | 0.894 | 0.973 | 0.971 | 0.985 | Venice | 0.970 | 0.900 | 0.951 | 0.971 | 0.976 |
|
Table 3. MEF-SSIM scores with different weight combinations
Image sequence (N) | Time |
---|
Average | 1.34 | Balloons (9) | 1.45 | Cave (4) | 0.82 | Chinese garden (3) | 0.69 | Farmhouse (3) | 0.67 | Lamp (6) | 1.01 | Landscape (3) | 0.62 | Madison (30) | 5.57 | Office (6) | 1.04 | Tower (3) | 0.85 | Venice (3) | 0.65 |
|
Table 4. Execution time of proposed method