
Peihua Jie, Zhenwei Xie, Xiaocong Yuan. Optical spiral vortex from azimuthally increasing/decreasing exponential phase gradients[J]. Chinese Optics Letters, 2023, 21(11): 112601
- Chinese Optics Letters
- Vol. 21, Issue 11, 112601 (2023)
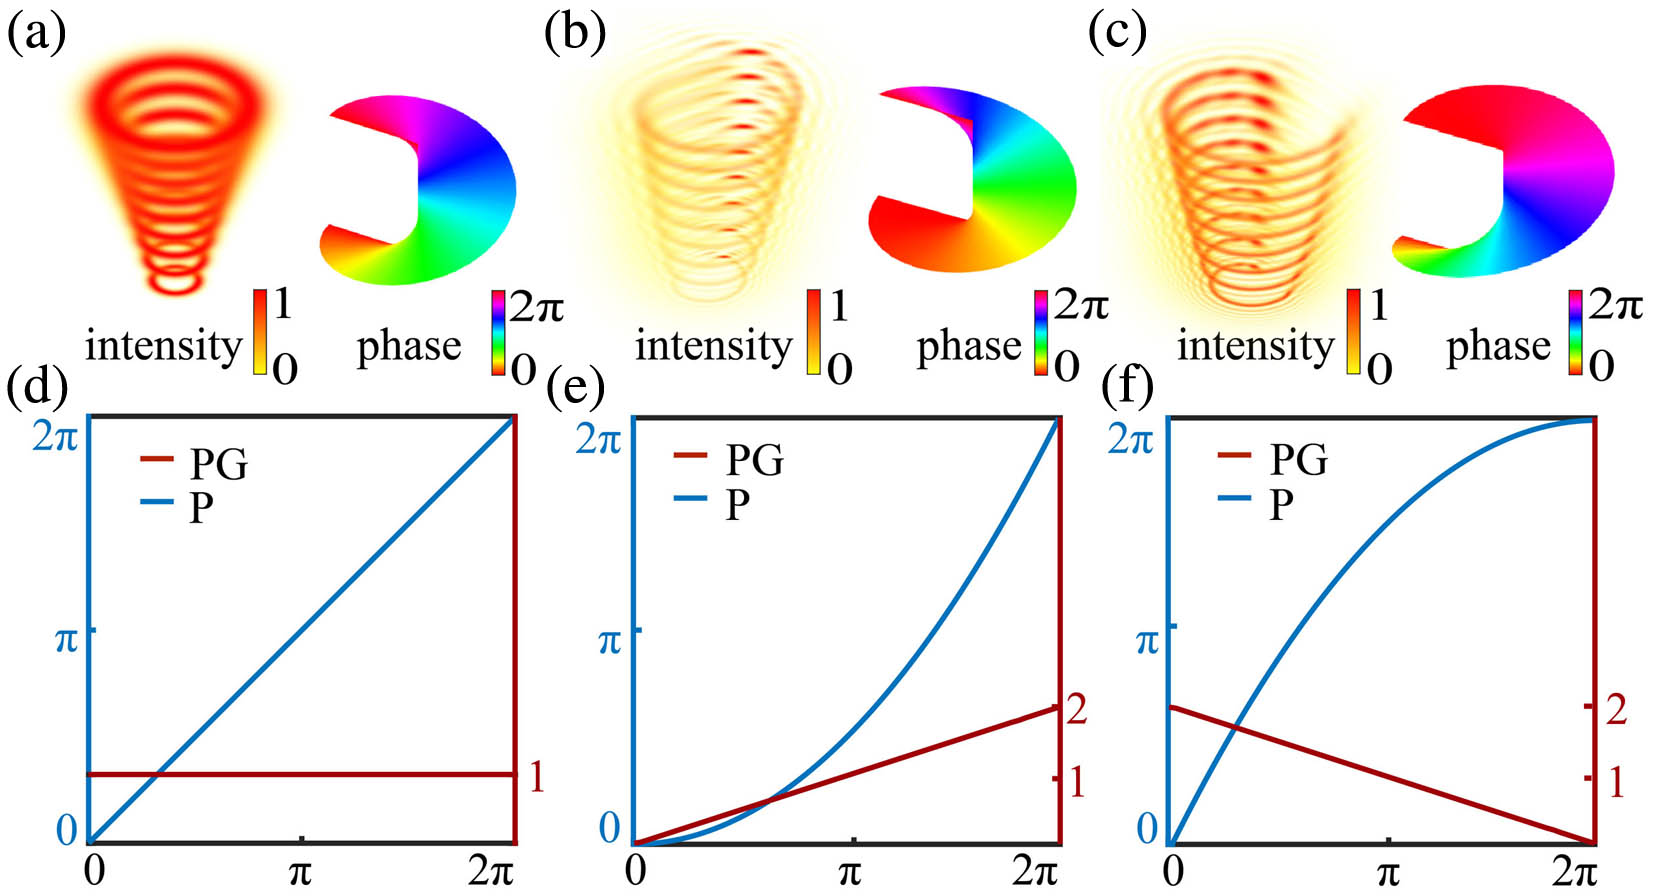
Fig. 1. Differences between OVs and PLBs. (a) Intensity and phase distributions of OAM. (b), (c) Intensity and phase distributions of PLBs. (d) Phase (P) and phase gradient (PG) of the OAM. (e), (f) P and PG of QO.
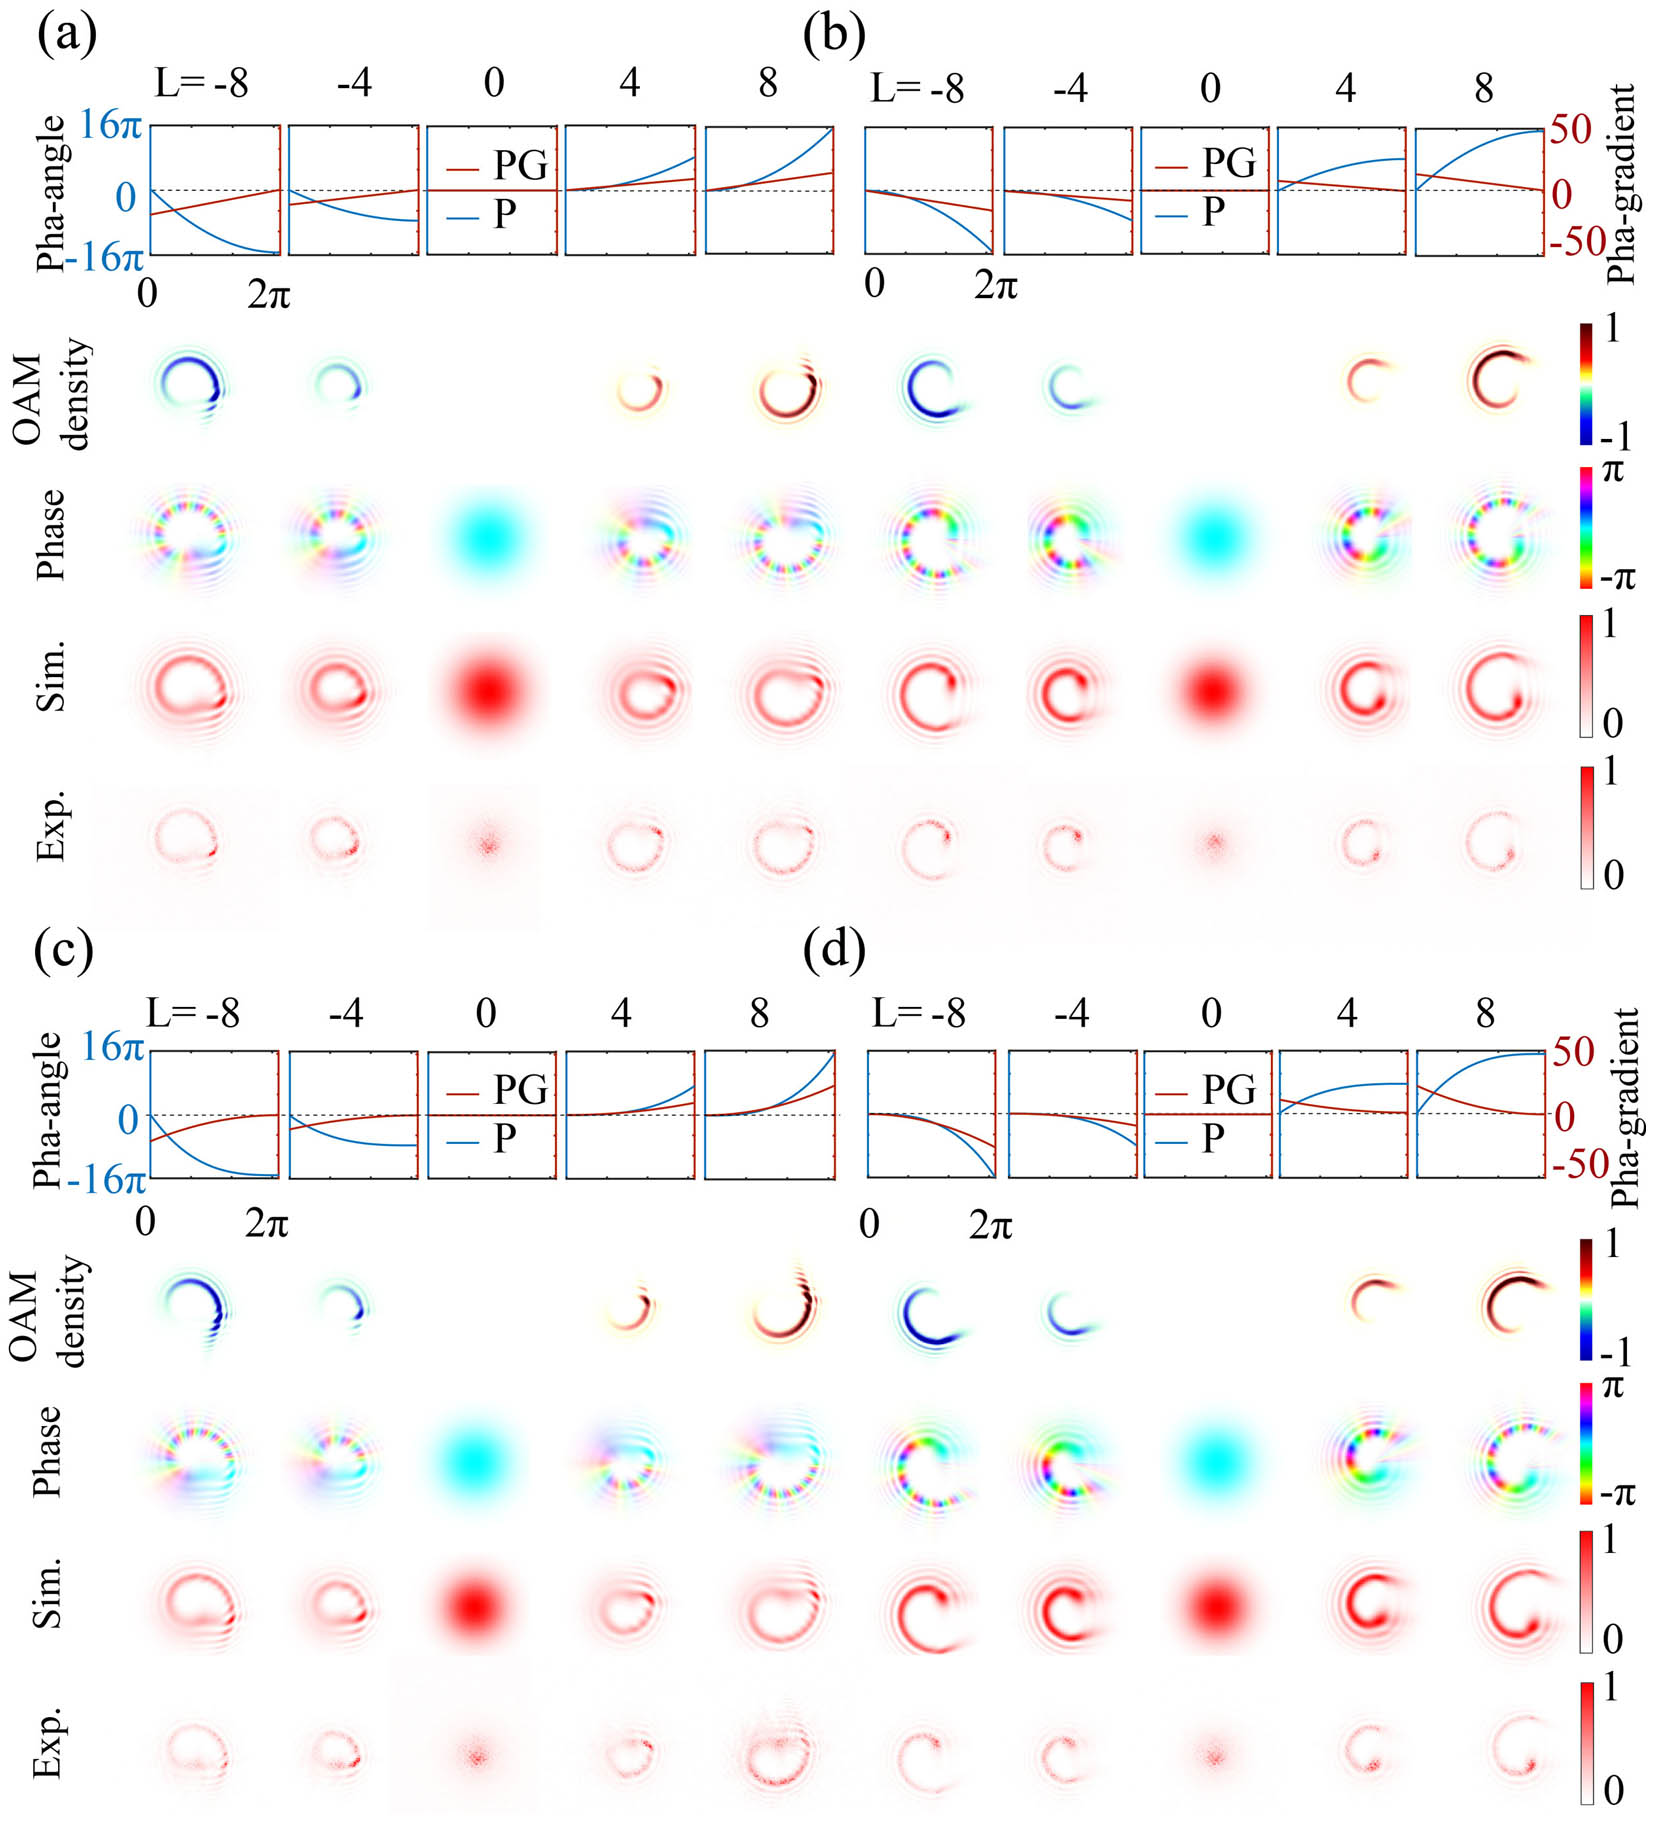
Fig. 2. Intensity profiles, phase distributions, and OAM density distributions of the (a), (b) QO and (c), (d) CO with different topological charges. (a), (c) The PG is increasing along the azimuth angle. (b), (d) The PG is decreasing along the azimuth angle. Further information regarding different topological charges can be found in Note 2 in the Supplementary Material .
Fig. 3. Intensity profiles, phase distributions, and OAM density distributions of the (a), (b) PQO and (c), (d) PCO with different topological charges. (a), (c) The PG is increasing along the azimuth angle. (b), (d) The PG is decreasing along the azimuth angle. Further information regarding different topological charges can be found in Note 2 in the Supplementary Material .
Fig. 4. Total OAM for light fields with different topological charges. (a) Total OAM of different topological charges for QO (red line), CO (blue line), and conventional OVs (black line). (b) Total OAM of different topological charges for PQO (red line), PCO (blue line), and conventional OAM (black line). The solid line indicates PGP, while the dashed line represents NGP.
Fig. 5. Orthogonality between different topological charges of NGP vortex beams for QO, CO, PQO, and PCO, respectively. Further information about PGP vector beams can be found in Note 4 in the Supplementary Material .

Set citation alerts for the article
Please enter your email address
© Copyright 2018-2021 | Chinese Laser Press. All Rights Reserved 沪ICP备15018463号-20