• Journal of Resources and Ecology
  • Vol. 11, Issue 3, 304 (2020)
Xiangtao WANG1、2, Xianzhou ZHANG1、2、3, Junhao WANG1、2, and Ben NIU1、2、*
Author Affiliations
  • 1Lhasa Plateau Ecosystem Research Station, Key Laboratory of Ecosystem Network Observation and Modeling, Institute of Geographic Sciences and Natural Resources Research, Chinese Academy of Sciences, Beijing 100101, China
  • 2University of Chinese Academy of Sciences, Beijing 100049, China
  • 3College of Resources and Environment, University of Chinese Academy of Sciences, Beijing 100190, China
  • show less
    DOI: 10.5814/j.issn.1674-764X.2020.03.008 Cite this Article
    Xiangtao WANG, Xianzhou ZHANG, Junhao WANG, Ben NIU. Variations in the Drought Severity Index in Response to Climate Change on the Tibetan Plateau[J]. Journal of Resources and Ecology, 2020, 11(3): 304 Copy Citation Text show less
    Linear trends for (a) Ta, average annual air temperature; (b) MAT, maximum air temperature; (c) MIT, minimum air temperature; (d) EMAT, extreme maximum air temperature; (e) EMIT, extreme minimum air temperature; (f) TP, total precipitation; (g) MAP, maximum precipitation; (h) Ea, average vapor pressure; (i) RH, average relative humidity; (j) MIRH, minimum relative humidity; (k) VPD, average vapor pressure deficit; (l) SP, percentage of sunshine; (m) SH, sunshine hours; and (n) WS, average wind speed; from 2000 to 2011 based on data from 69 meteorological stations on the Tibetan Plateau.
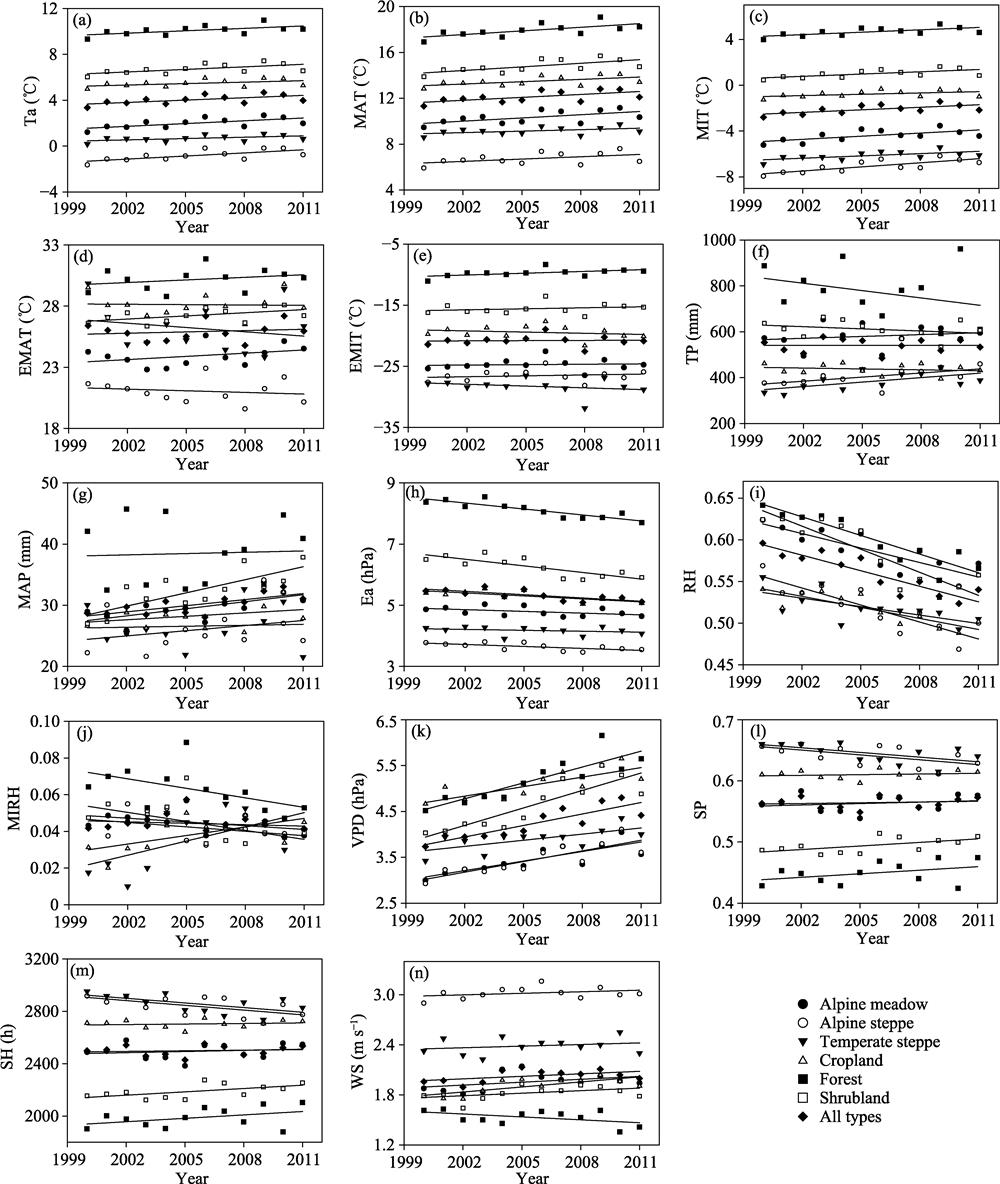
    Fig. 1. Linear trends for (a) Ta, average annual air temperature; (b) MAT, maximum air temperature; (c) MIT, minimum air temperature; (d) EMAT, extreme maximum air temperature; (e) EMIT, extreme minimum air temperature; (f) TP, total precipitation; (g) MAP, maximum precipitation; (h) Ea, average vapor pressure; (i) RH, average relative humidity; (j) MIRH, minimum relative humidity; (k) VPD, average vapor pressure deficit; (l) SP, percentage of sunshine; (m) SH, sunshine hours; and (n) WS, average wind speed; from 2000 to 2011 based on data from 69 meteorological stations on the Tibetan Plateau.
    Linear trends for the annual drought severity index (DSI) from 2000 to 2011, for different vegetation types on the Tibetan Plateau
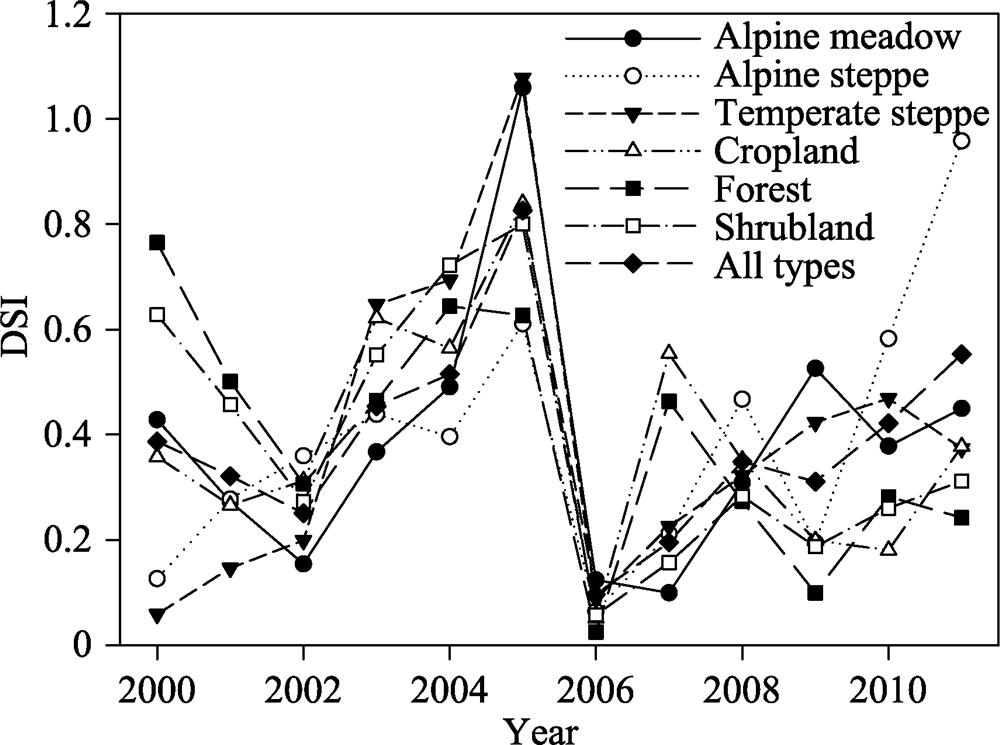
    Fig. 2. Linear trends for the annual drought severity index (DSI) from 2000 to 2011, for different vegetation types on the Tibetan Plateau
    Drought severity index trend from 2000 to 2011 on the Tibetan Plateau
    Fig. 3. Drought severity index trend from 2000 to 2011 on the Tibetan Plateau
    Relationships of the linear trend of the annual drought severity index (Slope_DSI) with climate variables on the Tibetan Plateau. (a) average annual temperature (Ta); (b) maximum annual temperature (MAT); (c) minimum annual temperature (MIT); (d) extreme maximum annual temperature (EMAT); (e) extreme minimum annual temperature (EMIT); (f) annual precipitation (TP); (g) maximum annual precipitation (MAP); (h) average annual vapor pressure (Ea); (i) annual sunshine percentage (SP); (j) annual sunshine hours (SH); and (k) average annual wind speed (WS).
    Fig. 4. Relationships of the linear trend of the annual drought severity index (Slope_DSI) with climate variables on the Tibetan Plateau. (a) average annual temperature (Ta); (b) maximum annual temperature (MAT); (c) minimum annual temperature (MIT); (d) extreme maximum annual temperature (EMAT); (e) extreme minimum annual temperature (EMIT); (f) annual precipitation (TP); (g) maximum annual precipitation (MAP); (h) average annual vapor pressure (Ea); (i) annual sunshine percentage (SP); (j) annual sunshine hours (SH); and (k) average annual wind speed (WS).
    Relationships between the linear trend of the annual drought severity index (Slope_DSI) and the linear trends of several climate factors: (a) maximum annual temperature (Slope_MAT); (b) extreme maximum annual temperature (Slope_EMAT); (c) extreme minimum annual temperature (Slope_EMIT); (d) annual precipitation (Slope_TP); (e) annual sunshine percentage (Slope_SP); and (f) annual sunshine hours (Slope_SH).
    Fig. 5. Relationships between the linear trend of the annual drought severity index (Slope_DSI) and the linear trends of several climate factors: (a) maximum annual temperature (Slope_MAT); (b) extreme maximum annual temperature (Slope_EMAT); (c) extreme minimum annual temperature (Slope_EMIT); (d) annual precipitation (Slope_TP); (e) annual sunshine percentage (Slope_SP); and (f) annual sunshine hours (Slope_SH).
    Annual trends for (a) Ta, average air temperature; (b) MAT, maximum air temperature; (c) MIT, minimum air temperature; (d) EMAT, extreme maximum air temperature; (e) EMIT, extreme minimum air temperature; (f) WS, average wind speed; from 2000 to 2011 at 69 meteorological stations on the Tibetan Plateau.
    Fig. 6. Annual trends for (a) Ta, average air temperature; (b) MAT, maximum air temperature; (c) MIT, minimum air temperature; (d) EMAT, extreme maximum air temperature; (e) EMIT, extreme minimum air temperature; (f) WS, average wind speed; from 2000 to 2011 at 69 meteorological stations on the Tibetan Plateau.
    Annual trends for (a) TP, total precipitation; (b) MAP, maximum precipitation; (c) Ea, average vapor pressure; (d) RH, average relative humidity; (e) MIRH, minimum relative humidity; (f) VPD, average vapor pressure deficit; from 2000 to 2011 at 69 meteorological stations on the Tibetan Plateau.
    Fig. 7. Annual trends for (a) TP, total precipitation; (b) MAP, maximum precipitation; (c) Ea, average vapor pressure; (d) RH, average relative humidity; (e) MIRH, minimum relative humidity; (f) VPD, average vapor pressure deficit; from 2000 to 2011 at 69 meteorological stations on the Tibetan Plateau.
    Annual trends for (a) SP, percentage of sunshine; (b) SH, sunshine hours; from 2000 to 2011 at 69 meteorological stations on the Tibetan Plateau.
    Fig. 8. Annual trends for (a) SP, percentage of sunshine; (b) SH, sunshine hours; from 2000 to 2011 at 69 meteorological stations on the Tibetan Plateau.
    Correlation coefficients of the drought severity index (DSI) with: (a) Ta, average air temperature; (b) MAT, maximum air temperature; (c) MIT, minimum air temperature; (d) EMAT, extreme maximum air temperature; (e) EMIT, extreme minimum air temperature; (f) WS, average wind speed; from 2000 to 2011 at 69 meteorological stations on the Tibetan Plateau.
    Fig. 9. Correlation coefficients of the drought severity index (DSI) with: (a) Ta, average air temperature; (b) MAT, maximum air temperature; (c) MIT, minimum air temperature; (d) EMAT, extreme maximum air temperature; (e) EMIT, extreme minimum air temperature; (f) WS, average wind speed; from 2000 to 2011 at 69 meteorological stations on the Tibetan Plateau.
    Correlation coefficients of the drought severity index (DSI) with: (a) TP, total precipitation; (b) MAP, maximum precipitation; (c) Ea, average vapor pressure; (d) RH, average relative humidity; (e) MIRH, minimum relative humidity; (f) VPD, average vapor pressure deficit; from 2000 to 2011 at 69 meteorological stations on the Tibetan Plateau.
    Fig. 10. Correlation coefficients of the drought severity index (DSI) with: (a) TP, total precipitation; (b) MAP, maximum precipitation; (c) Ea, average vapor pressure; (d) RH, average relative humidity; (e) MIRH, minimum relative humidity; (f) VPD, average vapor pressure deficit; from 2000 to 2011 at 69 meteorological stations on the Tibetan Plateau.
    Correlation coefficients of the drought severity index (DSI) with annual: (a) SP, percentage of sunshine; (b) SH, sunshine hours; from 2000 to 2011 at 69 meteorological stations on the Tibetan Plateau.
    Fig. 11. Correlation coefficients of the drought severity index (DSI) with annual: (a) SP, percentage of sunshine; (b) SH, sunshine hours; from 2000 to 2011 at 69 meteorological stations on the Tibetan Plateau.
    TypesTaMATMITEMATEMITTPMAPEaRHMIRHVPDSPSHWS
    Alpine meadows-0.11-0.420.26-0.43-0.080.59*0.200.67*0.500.71**-0.35-0.85***-0.87***0.49
    Alpine steppes0.28-0.070.58*-0.360.200.70*0.190.07-0.17-0.350.23-0.74**-0.74**0.19
    Temperate steppes0.200.100.250.040.570.42-0.190.29-0.160.070.34-0.23-0.190.18
    Croplands-0.34-0.48-0.14-0.55-0.050.43-0.220.360.500.26-0.49-0.90***-0.91***0.26
    Forests-0.71**-0.77**-0.73**-0.63*-0.69*0.540.240.74**0.78**-0.04-0.76**-0.66*-0.65*-0.02
    Shrublands-0.66*-0.78**-0.51-0.61*-0.360.66*-0.430.69*0.75**0.83***-0.73**-0.75**-0.75**0.03
    All types-0.28-0.49-0.03-0.40-0.110.61*-0.180.540.500.74**-0.42-0.86***-0.86***0.31
    Table 1.

    Correlation coefficients for spatially averaged annual drought severity index (DSI) with spatially averaged climate factors from 2000 to 2011 at 69 meteorological stations on the Tibetan Plateau

    Xiangtao WANG, Xianzhou ZHANG, Junhao WANG, Ben NIU. Variations in the Drought Severity Index in Response to Climate Change on the Tibetan Plateau[J]. Journal of Resources and Ecology, 2020, 11(3): 304
    Download Citation