1Lhasa Plateau Ecosystem Research Station, Key Laboratory of Ecosystem Network Observation and Modeling, Institute of Geographic Sciences and Natural Resources Research, Chinese Academy of Sciences, Beijing 100101, China
2University of Chinese Academy of Sciences, Beijing 100049, China
3College of Resources and Environment, University of Chinese Academy of Sciences, Beijing 100190, China
Xiangtao WANG, Xianzhou ZHANG, Junhao WANG, Ben NIU. Variations in the Drought Severity Index in Response to Climate Change on the Tibetan Plateau[J]. Journal of Resources and Ecology, 2020, 11(3): 304
Copy Citation Text
Drought is an important climate event and is linked to water availability, temperature, sunshine, and wind speed (Dai, 2011; Trenberth et al., 2014). Generally, water availability plays an important role in terrestrial ecosystems, and drought has an adverse effect on vegetation growth (Mu et al., 2013; Wang et al., 2013). Several studies have focused on how drought changes under climate change. However, neither modeling nor observations provide a widely accepted answer to the question of how climate change impacts drought (Sheffield et al., 2012; Dai, 2013; Trenberth et al., 2014). Understanding the relationship between drought and changes in climate factors is crucial for predicting future changes in aridity and coping with drought-related issues.
Drought is an important climate event and is linked to water availability, temperature, sunshine, and wind speed (Dai, 2011; Trenberth et al., 2014). Generally, water availability plays an important role in terrestrial ecosystems, and drought has an adverse effect on vegetation growth (Mu et al., 2013; Wang et al., 2013). Several studies have focused on how drought changes under climate change. However, neither modeling nor observations provide a widely accepted answer to the question of how climate change impacts drought (Sheffield et al., 2012; Dai, 2013; Trenberth et al., 2014). Understanding the relationship between drought and changes in climate factors is crucial for predicting future changes in aridity and coping with drought-related issues.
The Tibetan Plateau is one of the landscapes considered to be sensitive to climate change (IPCC, 2013; Li et al., 2019). Approximately two-thirds of the Tibetan Plateau is covered with arid and semiarid alpine ecosystems that are expected to become much drier as global warming continues (Seager et al., 2010). Therefore, alpine ecosystems on the Tibetan Plateau are likely to endure more extreme warming than biomes elsewhere (IPCC, 2013). It is predicted that global warming will exacerbate drought severity in the future (Trenberth et al., 2014). Several recent studies have also indicated that the decreased magnitude of soil moisture in in-situ experiments is due to the magnitude of increase in soil temperature (Shen et al., 2016; Zhong et al., 2016; Yu et al., 2019b). These findings imply that drought risk may be more extensive, and its magnitude may be greater on the Tibetan Plateau compared to other regions of the world. For example, Wang and Chen (2014) have found that drought risk on the Tibetan Plateau is much higher than it is on average in other parts of China.
The impact of climate change varies across different vegetation types on the Tibetan Plateau (Fu et al., 2016). To the best of our knowledge, there is an absence of research that examines correlations between inter-annual variations of the drought index and climate change across vegetation types on the Tibetan Plateau. Moreover, previous studies of the Tibetan Plateau have focused mainly on the correlation of the drought index with temperature and precipitation and not considered other climate factors (e.g., vapor pressure, relative humidity, wind speed and hours of sunshine) (Liu et al., 2014; Yang et al., 2014). Recently, the Moderate Resolution Imaging Spectroradiometer (MODIS) introduced a new drought index called the drought severity index (DSI) that uses MODIS-derived actual and potential evapotranspiration, and the normalized difference vegetation index (NDVI) (Mu et al., 2013). This index facilitates analyses of drying conditions and relationships associated with climate factors at a global or regional scale. In this study, we used MODIS DSI data and meteorological data to: 1) analyze and compare inter-annual variations of DSI and their relationships with climate factors across key alpine ecosystems; and 2) examine whether global warming has a negative effect on the DSI of the Tibetan Plateau.
2 Materials and methods
2.1 Study area
Known as the Third Pole by some, the Tibetan Plateau has distinctive features including high elevation (elevation 【-逻*辑*与-】gt;4000 m), strong solar radiation, thin air and low temperatures. The predominant vegetation types include alpine meadows, alpine steppes, temperate steppes, forests, shrublands, and croplands.
2.2 Drought severity index (DSI) data
The vegetation response-incorporated DSI products used in this study were obtained from MODIS16 onboard the NASA Earth Observing System (EOS) Terra and Aqua satellites. The MODIS 16 evapotranspiration (ET) and potential evapotranspiration (PET) data were used as primary inputs to calculate the DSI; the spatial resolution was 0.05°×0.05° and the temporal resolution was one year. The specific calculation follows Mu et al. (2013); the ratio of ET to PET is shown in Eq. (1):
$Ratio=ET/PET$
The temporal standard deviation of ratio (${{\sigma }_{Ratio}}$) and ratio average ($\overline{Ratio}$) were then computed on a grid cell-wise basis over the available satellite record (from 2000 to present). The standardized ratio (ZRatio) was then calculated as:
The remotely sensed DSI was finally calculated as the standardized Z value:
$DSI=Z-\bar{Z}/{{\sigma }_{z}}$
Compared to traditional drought monitoring methods, DSI enhances the capability of near real-time drought monitoring (Mu et al., 2013). In addition, DSI is associated with the remote-sensing net primary productivity of vegetation (NPP). DSI and NPP can be used together to evaluate the interaction between water supply and ecosystems, including the effects of drought on crop yields and forest productivity (Atkinson et al., 2011). This can assist in regional drought assessment and the timely and effective development of drought mitigation strategies.
2.3 Climate data
We obtained climate data from the China Meteorological Data Sharing Service System (http://cdc.cma.gov.cn/). The study used data from a total of 69 meteorological stations. Of these stations, 22 stations were in alpine meadows, 8 in alpine steppes, 4 in temperate steppes, 7 in forests, 12 in shrublands and 16 in croplands. Climate data included five temperature factors (average annual air temperature (Ta), maximum air temperature (MAT), minimum air temperature (MIT), extreme maximum air temperature (EMAT), and extreme minimum air temperature (EMIT)), two precipitation factors (total annual precipitation (TP), and maximum precipitation (MAP)), four humidity factors (average annual vapor pressure (Ea), relative humidity (RH), minimum relative humidity (MIRH), and vapor pressure deficit (VPD)), two sunshine factors (annual percentage of sunshine (SP) and total sunshine hours (SH)), and average annual wind speed (WS).
2.4 Data analysis
The map for vegetation type (1:1000000 scale) was converted into a raster file (0.05°×0.05° spatial resolution) prior to other analyses. We used the slope and intercept of the regression straight line to analyze changes in DSI and the five temperature factors, two precipitation factors, four humidity factors, two sunshine factors, and annual average wind speed. We used a correlation analysis to analyze the relationship between DSI and the climate factors. All spatial analyses were performed using ArcGIS (version 9.3).
3 Results and discussion
3.1 Climate factor changes
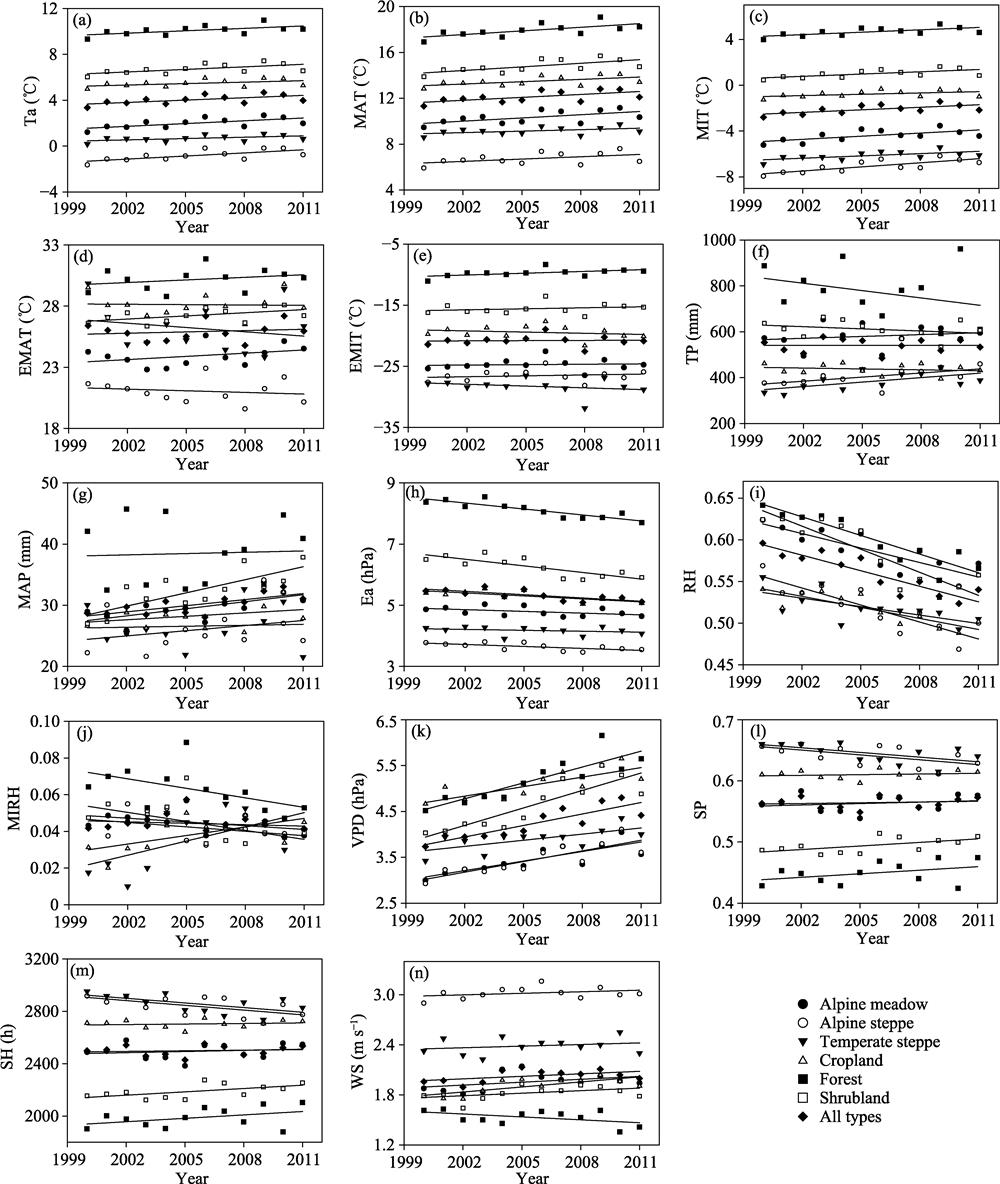
The climate became warmer and drier from 2000 to 2011, based on meteorological records for the Tibetan Plateau (Fig. 1). Specifically, average Ta, MAT, and MIT increased by 0.07, 0.09 and 0.07 ℃ yr-1, respectively. Spatially, average MAP and VPD showed increasing trends of 0.33 mm yr-1 and 0.01 hPa yr-1, while Ea and RH decreased by -0.04 hPa yr-1 and -0.01 hPa yr-1. However, climate changes varied with vegetation type (Fig. 1), a finding consistent with those of previous studies (Fu et al., 2016; Shen et al., 2014). The climate showed warming and drying trends from 2000 to 2011 at meteorological stations in alpine meadows, alpine steppes, forests, and shrublands. However, meteorological stations in temperate steppes and croplands showed only a drying trend. Additionally, it became dimmer in alpine steppes and temperate steppes, and brighter in shrublands, based on data for the percentage of sunshine and sunshine hours (Fig. 1).
Figure 1.
Linear trends for (a) Ta, average annual air temperature; (b) MAT, maximum air temperature; (c) MIT, minimum air temperature; (d) EMAT, extreme maximum air temperature; (e) EMIT, extreme minimum air temperature; (f) TP, total precipitation; (g) MAP, maximum precipitation; (h) Ea, average vapor pressure; (i) RH, average relative humidity; (j) MIRH, minimum relative humidity; (k) VPD, average vapor pressure deficit; (l) SP, percentage of sunshine; (m) SH, sunshine hours; and (n) WS, average wind speed; from 2000 to 2011 based on data from 69 meteorological stations on the Tibetan Plateau.
Spatially averaged DSI change varied among vegetation types (Fig. 2). Forests were the only vegetation type to experience a decrease in spatially averaged DSI with a rate of -0.039 yr-1. The DSI for other vegetation types increased in recent years. This was mainly because the largest magnitude of TP decreased and VPD increased among the six vegetation types.
Figure 2.
Linear trends for the annual drought severity index (DSI) from 2000 to 2011, for different vegetation types on the Tibetan Plateau
Inter-annual DSI change during recent years varied among the 69 meteorological stations (Fig. 3). Eight stations showed a decrease, with rates from -0.13 to -0.09 yr-1. In contrast, only the Wudaoliang station had an increase with a rate of 0.10 yr-1. This finding was consistent with previous studies which indicated that changes of water availability had varied from station to station on the Tibetan Plateau in recent years (Sun et al., 2013; Shen et al., 2014). Overall, the southern Tibetan Plateau showed a drying trend, while the northern Tibetan Plateau showed a wetting trend (Fig. 3). This finding is consistent with previous studies (Wang et al., 2013; Zhang et al., 2013).
The change rate of DSI decreased with increasing temperatures (i.e., Ta, MAT, MIT, EMAT, and EMIT), and environmental humidity (TP, MAP, and Ea), but increased with increasing SP, SH, and WS (Fig. 4). These findings indicate that DSI was more responsive to warming in colder environments, to water availability in drier environments and to sunshine conditions in more brightly lit environments. Therefore, clarifying the correlation between DSI and water availability requires consideration of local climate conditions.
Figure 3.
Drought severity index trend from 2000 to 2011 on the Tibetan Plateau
DSI change showed a positive relationship with TP change, but negative correlations with temperature (MAT, EMAT, EMIT), SP and SH changes (Fig. 5). Likewise, recent studies found that higher experimental warming resulted in greater environmental drying (Li et al., 2011; Yu et al., 2019b). These findings indicate that the magnitude of warming and water availability had opposite effects on changes to DSI. Additionally, the negative effect of changes to sunshine conditions on DSI dampened the positive effect of the change of water availability on DSI (Fig. 5). Changes to climate factors and background values differed among the six vegetation types and among the 69 meteorological stations (Fig. 1, Fig. 6, Fig. 7, Fig. 8). This evidence suggests that inter-annual DSI variations may be attributed to changes in climate factors and changes in the background values of climate factors among the six vegetation types or among the 69 meteorological stations. For example, in winter, the land cover of different vegetation types can vary greatly. There can be evergreen plants in forests and winter crops in croplands. In addition, canopy coverages can change with vegetation types (Shen et al., 2014). Dense canopy often has higher transpiration and lower soil moisture, while shielding against incident solar radiation and soil longwave radiation (Sun and Kafatos, 2007; Kerchove et al., 2013).
Thus, the findings in our study suggest that the correlations between DSI change and climate factors are dependent on local climate conditions.
Figure 4.
Relationships of the linear trend of the annual drought severity index (Slope_DSI) with climate variables on the Tibetan Plateau. (a) average annual temperature (Ta); (b) maximum annual temperature (MAT); (c) minimum annual temperature (MIT); (d) extreme maximum annual temperature (EMAT); (e) extreme minimum annual temperature (EMIT); (f) annual precipitation (TP); (g) maximum annual precipitation (MAP); (h) average annual vapor pressure (Ea); (i) annual sunshine percentage (SP); (j) annual sunshine hours (SH); and (k) average annual wind speed (WS).
Relationships between the linear trend of the annual drought severity index (Slope_DSI) and the linear trends of several climate factors: (a) maximum annual temperature (Slope_MAT); (b) extreme maximum annual temperature (Slope_EMAT); (c) extreme minimum annual temperature (Slope_EMIT); (d) annual precipitation (Slope_TP); (e) annual sunshine percentage (Slope_SP); and (f) annual sunshine hours (Slope_SH).
Annual trends for (a) Ta, average air temperature; (b) MAT, maximum air temperature; (c) MIT, minimum air temperature; (d) EMAT, extreme maximum air temperature; (e) EMIT, extreme minimum air temperature; (f) WS, average wind speed; from 2000 to 2011 at 69 meteorological stations on the Tibetan Plateau.
Spatially averaged DSI was related positively to spatially averaged TP and MIRH, but correlated negatively to SP and SH at all of the 69 meteorological stations (Table 1). Therefore, DSI can mirror water availability conditions, and it is likely that the increase in sunshine resulted in drying around all of the meteorological stations (Mu et al., 2013).
Types
Ta
MAT
MIT
EMAT
EMIT
TP
MAP
Ea
RH
MIRH
VPD
SP
SH
WS
Alpine meadows
-0.11
-0.42
0.26
-0.43
-0.08
0.59*
0.20
0.67*
0.50
0.71**
-0.35
-0.85***
-0.87***
0.49
Alpine steppes
0.28
-0.07
0.58*
-0.36
0.20
0.70*
0.19
0.07
-0.17
-0.35
0.23
-0.74**
-0.74**
0.19
Temperate steppes
0.20
0.10
0.25
0.04
0.57
0.42
-0.19
0.29
-0.16
0.07
0.34
-0.23
-0.19
0.18
Croplands
-0.34
-0.48
-0.14
-0.55
-0.05
0.43
-0.22
0.36
0.50
0.26
-0.49
-0.90***
-0.91***
0.26
Forests
-0.71**
-0.77**
-0.73**
-0.63*
-0.69*
0.54
0.24
0.74**
0.78**
-0.04
-0.76**
-0.66*
-0.65*
-0.02
Shrublands
-0.66*
-0.78**
-0.51
-0.61*
-0.36
0.66*
-0.43
0.69*
0.75**
0.83***
-0.73**
-0.75**
-0.75**
0.03
All types
-0.28
-0.49
-0.03
-0.40
-0.11
0.61*
-0.18
0.54
0.50
0.74**
-0.42
-0.86***
-0.86***
0.31
Table 1.
Correlation coefficients for spatially averaged annual drought severity index (DSI) with spatially averaged climate factors from 2000 to 2011 at 69 meteorological stations on the Tibetan Plateau
Annual trends for (a) TP, total precipitation; (b) MAP, maximum precipitation; (c) Ea, average vapor pressure; (d) RH, average relative humidity; (e) MIRH, minimum relative humidity; (f) VPD, average vapor pressure deficit; from 2000 to 2011 at 69 meteorological stations on the Tibetan Plateau.
Spatially averaged DSI increased as TP increased in alpine meadows, alpine steppes and shrublands (Table 1). Spatially averaged DSI showed a positive correlation with Ea in alpine meadows, forests, and shrublands (Table 1). Spatially averaged DSI decreased as VPD increased, but increased as RH increased in forests and shrublands (Table 1). Spatially averaged DSI showed a positive relationship with MIRH in alpine meadows and shrublands (Table 1). These findings indicate that DSI can mirror the dynamics of water availability at the whole ecosystem scale. However, the degree of correlation between DSI and climate factors related to water availability varied with vegetation type (Table 1). Therefore, clarifying the correlation between DSI and water availability requires taking into consideration the type of ecosystem.
Generally, correlations between DSI and climate factors varied among the 69 meteorological stations. At three stations, wind speed was the dominant factor influencing DSI, at 26 stations temperature factors were dominant, at 11 stations precipitation factors were dominant, at 15 stations air humidity factors were dominant, and at 14 stations sunshine factors were dominant. Most stations showed positive correlations between DSI and water availability, and these stations were distributed mainly in the center and east of Tibet, the east and south of Qinghai and the northwest of Sichuan (Fig. 9, Fig.10, Fig.11). A study of the spatial and temporal drought patterns in Tibet from 1981 to 2013, based on the standardized precipitation index (SPI), also showed that the center and east of Tibet experienced a high frequency of severe drought (Yuan et al., 2015).
Figure 9.
Correlation coefficients of the drought severity index (DSI) with: (a) Ta, average air temperature; (b) MAT, maximum air temperature; (c) MIT, minimum air temperature; (d) EMAT, extreme maximum air temperature; (e) EMIT, extreme minimum air temperature; (f) WS, average wind speed; from 2000 to 2011 at 69 meteorological stations on the Tibetan Plateau.
Most meteorological stations showed negative correlations between DSI and sunshine conditions, and these stations were distributed mainly in the east of Tibet, the south of Qinghai and the northwest of Sichuan. Among this group of stations, ten stations were found to have significant correlations (P【-逻*辑*与-】lt;0.05), and these station were located in the southeast of Qinghai and the northwest of Sichuan (Fig. 11). Most stations also showed negative correlations of DSI with MAT and EMAT, and these stations were distributed mainly in the center and east of Tibet, the southeast of Qinghai and the northwest of Sichuan. There were more than ten stations that showed significant correlations of DSI with MAT (P【-逻*辑*与-】lt;0.05), located in the southeast of Tibet and the northwest of Sichuan (Fig. 9).
More than 50% of the meteorological stations showed negative correlations of DSI with Ta, MIT and EMIT, and these stations were distributed mainly in central and eastern Tibet and the northwest of Sichuan. Five stations showed significant correlations of DSI with Ta and MIT (P【-逻*辑*与-】lt; 0.05), and these were located in the northwest of Sichuan (Fig. 9). These findings indicate that DSI can mirror water availability at the individual meteorological station scale. Wang et al. (2013) demonstrated that meteorological stations with high sensitivity to change in the dryness index during the growing season were mainly concentrated in the central and eastern parts of the Tibetan Plateau. This finding was based on observational data from ground meteorological stations and MODIS enhanced vegetation index data for the years 2001 to 2010 (Wang et al., 2013). Moreover, both global warming and the increase in sunshine resulted in drying at most stations. This finding is consistent with previous studies conducted on the Tibetan Plateau (Klein et al., 2004; Shen et al., 2015).
Spatially averaged DSI decreased as Ta, MAT, and EMAT increased in forests and shrublands (Table 1). Spatially averaged DSI also showed a negative correlation with MIT and EMIT in forests (Table 1). These findings indicate that global warming may result in drying at the whole ecosystem scale; this finding is consistent with those of previous studies (Wang et al., 2015; Yu et al., 2019a). Spatially averaged DSI showed a negative correlation with SP and SH in alpine meadows, alpine steppes, croplands, forests and shrublands (Table 1), suggesting that the increase of sunshine may cause drying at the whole ecosystem scale.
Figure 10.
Correlation coefficients of the drought severity index (DSI) with: (a) TP, total precipitation; (b) MAP, maximum precipitation; (c) Ea, average vapor pressure; (d) RH, average relative humidity; (e) MIRH, minimum relative humidity; (f) VPD, average vapor pressure deficit; from 2000 to 2011 at 69 meteorological stations on the Tibetan Plateau.
Correlation coefficients of the drought severity index (DSI) with annual: (a) SP, percentage of sunshine; (b) SH, sunshine hours; from 2000 to 2011 at 69 meteorological stations on the Tibetan Plateau.
In this study, we investigated the correlation of DSI with 14 climate factors (including factors for temperature, precipitation, humidity, wind speed, and sunshine) from 2000 to 2011 on the Tibetan Plateau. Our main conclusions are as follows: 1) spatial DSI averages increased as precipitation and minimum relative humidity increased, but decreased as sunshine increased; 2) The correlation between DSI and climate factors differed due to the changes of the climate factors and the difference of background values among different vegetation types; and 3) The degree of correlation between DSI and climate change was stronger in environments that were colder and drier, and had higher wind speeds and more sunshine. These findings indicate that DSI can mirror the dynamics of water availability regardless of location or ecosystem scale. This study provides a scientific basis for local meteorological departments to implement effective, long-term drought monitoring programs. This is important and has practical significance for agriculture, animal husbandry and human life in alpine regions.
References
[1] Atkinson PM, DashJ, JeganathanC. Amazon vegetation greenness as measured by satellite sensors over the last decade. Geophysical Research Letters, 38, 1-6(2011).
[3] Dai AG. Increasing drought under global warming in observations and models. Nature Climate Change, 3, 52-58(2013).
[5] . Summary for Policymakers. In: Stocker T F,
Qin D, Plattner G K, et al.(eds.).
Climate change 2013:
The physical science basis. Contribution of working group I to the fifth assessment report of the intergovernmental panel on climate change(2013).
[7] Klein JA, HarteJ, Zhao XQ. Experimental warming causes large and rapid species loss, dampened by simulated grazing on the Tibetan Plateau. Ecology Letters, 7, 1170-1179(2004).
[8] Li LY, ZhangJ, WuS et al. Increasing sensitivity of alpine grasslands to climate variability along an elevational gradient on the Qinghai-Tibet Plateau. Science of the Total Environment, 678, 21-29(2019).
[10] Liu DK, Wang JB, Qi SH. Analysis on dry trend based on moisture index in Qinghai Province in the recent 35 years. Research of Soil and Water Conservation, 21, 246-250(2014).
[12] SeagerR, NaikN, Vecchi GA. Thermodynamic and dynamic mechanisms for large-scale changes in the hydrological cycle in response to global warming. Journal of Climate, 23, 4651-4668(2010).
[15] Shen ZX, Li YL, FuG. Response of soil respiration to short-term experimental warming and precipitation pulses over the growing season in an alpine meadow on the Northern Tibet. Applied Soil Ecology, 90, 35-40(2015).
[16] Shen ZX, Wang JW, SunW et al. The soil drying along the increase of warming mask the relation between temperature and soil respiration in an alpine meadow of Northern Tibet. Polish Journal of Ecology, 64, 125-129(2016).
[17] SunD, KafatosM. Note on the NDVI-LST relationship and the use of temperature-related drought indices over North America. Geophysical Research Letters, 34, 497-507(2007).
[19] Trenberth KE, Dai AG, van der SchrierG et al. Global warming and changes in drought. Nature Climate Change, 4, 17-22(2014).
[20] WangL, ChenW. A CMIP5 multimodel projection of future temperature, precipitation, and climatological drought in China. International Journal of Climatology, 34, 2059-2078(2014).
[21] WangM, Zhou CP, WuL et al. Wet-drought pattern and its relationship with vegetation change in the Qinghai-Tibetan Plateau during 2001-2010. Arid Land Geography, 36, 49-56(2013).
[22] Wang SH, SunW, Li SW et al. Interannual variation of the growing season maximum normalized difference vegetation index, MNDVI, and its relationship with climatic factors on the Tibetan Plateau. Polish Journal of Ecology, 63, 424-439(2015).
[23] Wang SP, Duan JC, Xu GP et al. Effects of warming and grazing on soil N availability, species composition, and ANPP in an alpine meadow. Ecology, 93, 2365-2376(2012).
[24] Yang XH, ZhuoG, LuoB. Drought monitoring in the Tibetan Plateau based on MODIS dataset. Journal of Desert Research, 34, 527-534(2014).
[25] YuanL, LiuY, Ma PF. Analysis of temporal and spatial characteristics of drought in Tibet from 1981 to 2013 based on standardized precipitation index. China Agronomy Bulletin, 31, 228-234(2015).
[27] Yu CQ, Wang JW, Shen ZX et al. Effects of experimental warming and increased precipitation on soil respiration in an alpine meadow in the Northern Tibetan Plateau. Science of the Total Environment, 647, 1490-1497(2019).
Xiangtao WANG, Xianzhou ZHANG, Junhao WANG, Ben NIU. Variations in the Drought Severity Index in Response to Climate Change on the Tibetan Plateau[J]. Journal of Resources and Ecology, 2020, 11(3): 304