Author Affiliations
1Chinese Academy of Sciences, Shanghai Institute of Microsystem and Information Technology, Key Laboratory of Terahertz Solid State Technology, Shanghai, China2University of Chinese Academy of Sciences, Center of Materials Science and Optoelectronics Engineering, Beijing, China3ShanghaiTech University, School of Information Science and Technology, Shanghai, Chinashow less
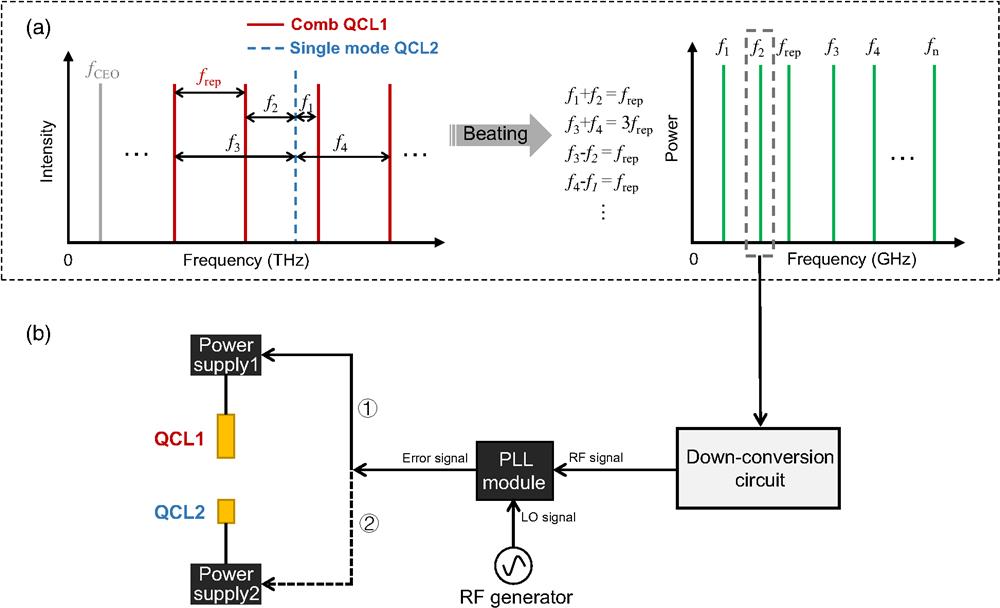
Fig. 1. Scheme of the proposed relative phase locking. (a) Frequency components in the THz (left panel) and microwave (right panel) frequency ranges. The red solid lines and blue dashed line represent the comb lines of QCL1 and the single emission line of QCL2 (), respectively. and denote the carrier envelope offset frequency and repetition frequency of QCL1. , , , and are the four lowest beating frequencies between and its neighboring comb lines of QCL1. In the right panel, the heterodyne signals and are shown by green lines. The formulas show the relations of these frequencies. (b) PLL scheme by selecting one of the heterodyne signals, . is downconverted to to satisfy the bandwidth requirement of the PLL module. RF generator is used to output an LO signal to mix with and generate the error signal for phase locking. In the circuit loops labeled ① and ②, the PLL error signal is fed back to QCL1 and QCL2, respectively.
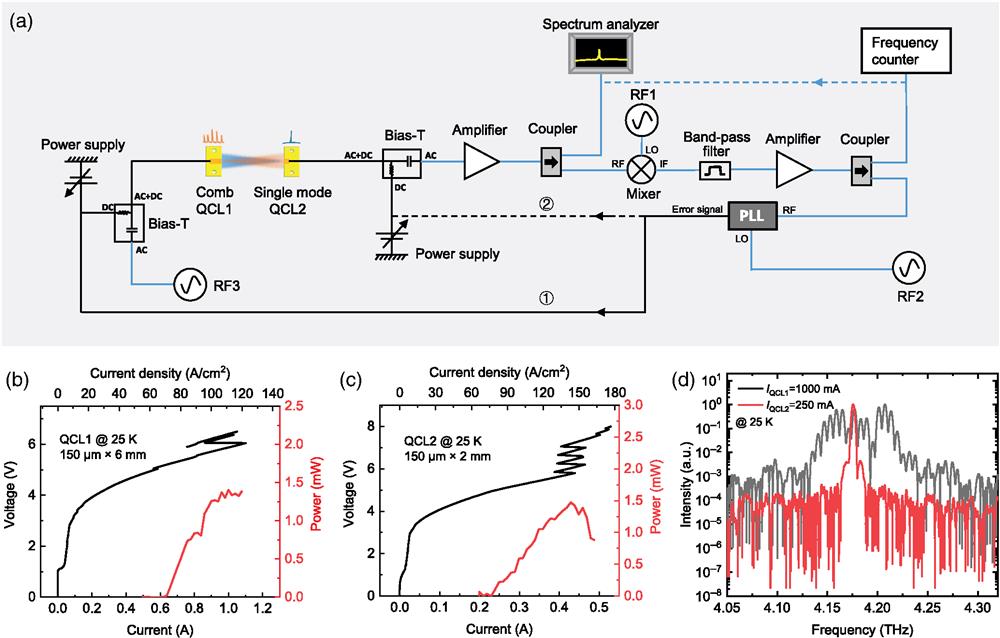
Fig. 2. (a) Experimental setup. QCL1 with a dimension of is operated in the comb state and QCL2 with a dimension of is operated in the single-mode state. The light of QCL1 (orange) and QCL2 (blue) is coupled to the facets of each other to enable the heterodyne beating between the two lasers. Herein the heterodyne beating signals in the microwave frequency range are detected by QCL2 utilizing the self-detection method. The detected signals are extracted using a bias-T and then amplified and split into two: one is sent to the spectrum analyzer for observation and analysis; the other is downconverted by mixing with RF1, filtered, amplified for phase locking. Simultaneously, the signal is sent to a frequency counter for the frequency stability evaluation. RF2 serves as the LO signal of the PLL module to generate the error signal. Loop ① and ② represent locks with the error feedback to QCL1 and QCL2, respectively. RF3 is employed for the injection locking of QCL1 to stabilize its repetition frequency. (b) and (c) are curves of QCL1 and QCL2 measured in continuous-wave (CW) mode when the heat sink temperature is stabilized at 25 K. (d) Emission spectra of QCL1 and QCL2 measured using a Fourier transform infrared spectrometer. For the spectral measurements, QCL1 and QCL2 are, respectively, operated at drive currents of 1000 and 250 mA at 25 K.
Fig. 3. Measured intermode beatnote of QCL1 and heterodyne signals resulting from the beating between QCL1 and QCL2. A resolution bandwidth (RBW) of 1 kHz and a video bandwidth (VBW) of 200 Hz are used for the beatnote measurements. QCL1 and QCL2 are operated at 950 and 275 mA, respectively, at a heat sink temperature of 26.5 K.
Fig. 4. (a) Maxhold traces of unlocked (black dashed line) and locked (blue solid line) intermode beatnote of QCL1. The RBW and VBW of the spectrum analyzer are set as 500 and 50 Hz, respectively. QCL1 and QCL2 are driven at 960 and 275 mA, respectively, at 25 K. (b) Maxhold trace of heterodyne beatnote measured using an RBW of 10 kHz and a VBW of 500 Hz when the RF injection is off. (c) Maxhold trace of heterodyne beatnote measured using an RBW of 10 kHz and a VBW of 500 Hz when the RF injection is on. In (b) and (c), QCL1 and QCL2 are operated at 960 and 275 mA, respectively, at 24.2 K.
Fig. 5. Maxhold traces of mesured in a time duration of 30 s under three laser operation conditions recorded using an RBW of 2 kHz and a VBW of 500 Hz. (a) RF injection is switched on and PLL is switched off. (b) Both RF injection and PLL are switched on, and the error signal of PLL is fed back to QCL1. (c) Both RF injection and PLL are switched on, and the error signal of PLL is fed back to QCL2. For the measurements, QCL1 and QCL2 are driven at 960 and 275 mA, respectively, at 25 K.
Fig. 6. Screenshots of Videos 1 and 2, which show phase-locking processes of when the error signal of PLL is, respectively, fed back to (a) QCL1 and (b) QCL2. (Video 1, MP4, 4.87 MB [URL: https://doi.org/10.1117/1.APN.2.2.026006.s1]; Video 2, MP4, 4.67 MB [URL: https://doi.org/10.1117/1.APN.2.2.026006.s2]).
Fig. 7. (a) Phase noise spectra of measured when the error signal is fed back to QCL1 (red curve) and QCL2 (black curve). (b) and (c) are high resolution phase locked spectra of obtained by sending the error signal to QCL1 or QCL2 recorded using an RBW of 1 Hz.
Fig. 8. (a) Frequency tuning of QCL1 when the drive current is changed from 960 to 961 mA with a step of 0.2 mA. The arrow shows the current increase direction. The tuning coefficient is derived to be . (b) Current change of QCL1 (green dots, left axis) when the error signal of PLL is fed back to it and the corresponding frequency change (red dots, right axis) within 1 mA. (c) Frequency tuning of QCL2 when the drive current is changed from 275 to 276 mA with a step of 0.2 mA. The arrow shows the current increase direction. The tuning coefficient is . (d) Current change of QCL2 (left axis) when the error signal of PLL is fed back to it and the corresponding frequency change (right axis). It is worth noting that in (b) and (d) the current values of the left axes are offset by the mean value of the recorded maximum and minimum currents.