1Chinese Academy of Sciences, Shanghai Institute of Microsystem and Information Technology, Key Laboratory of Terahertz Solid State Technology, Shanghai, China
2University of Chinese Academy of Sciences, Center of Materials Science and Optoelectronics Engineering, Beijing, China
3ShanghaiTech University, School of Information Science and Technology, Shanghai, China
Wen Guan, Ziping Li, Shumin Wu, Han Liu, Xuhong Ma, Yiran Zhao, Chenjie Wang, Binbin Liu, Zhenzhen Zhang, Juncheng Cao, Hua Li, "Relative phase locking of a terahertz laser system configured with a frequency comb and a single-mode laser," Adv. Photon. Nexus 2, 026006 (2023)
Copy Citation Text
Stable operation is one of the most important requirements for a laser source for high-precision applications. Many efforts have been made to improve the stability of lasers by employing various techniques, e.g., electrical and/or optical injection and phase locking. However, these techniques normally involve complex experimental facilities. Therefore, an easy implementation of the stability evaluation of a laser is still challenging, especially for lasers emitting in the terahertz (THz) frequency range because the broadband photodetectors and mature locking techniques are limited. In this work, we propose a simple method, i.e., relative phase locking, to quickly evaluate the stability of THz lasers without a need of a THz local oscillator. The THz laser system consists of a THz quantum cascade laser (QCL) frequency comb and a single-mode QCL. Using the single-mode laser as a fast detector, heterodyne signals resulting from the beating between the single-mode laser and the comb laser are obtained. One of the heterodyne beating signals is selected and sent to a phase-locked loop (PLL) for implementing the relative phase locking. Two kinds of locks are performed by feeding the output error signal of the PLL, either to the comb laser or to the single-mode laser. By analyzing the current change and the corresponding frequency change of the PLL-controlled QCL in each phase-locking condition, we, in principle, are able to experimentally compare the stability of the emission frequency of the single-mode QCL (fs) and the carrier envelope offset frequency (fCEO) of the QCL comb. The experimental results reveal that the QCL comb with the repetition frequency injection locked demonstrates much higher stability than the single-mode laser. The work provides a simple heterodyne scheme for understanding the stability of THz lasers, which paves the way for the further locking of the lasers and their high-precision applications in the THz frequency range.
Highly stabilized lasers, especially frequency combs,1–4 are always much in demand for high-precision applications, e.g., spectroscopy, ranging, and communications.5–7 To improve the laser stability, different approaches, e.g., optical feedback, microwave injection locking, optical injection locking, and phase locking,8–10 have been widely implemented.
In the entire electromagnetic spectrum, the terahertz (THz) region (roughly defined between 0.1 and 10 THz)11–13 shows great advantages in spectroscopy, imaging, metrology, and communications, on account of its unique characteristics, e.g., covering vibrational and rotational absorption lines (fingerprints) of plentiful molecules, transparency to some packaging materials, and broader potential communication bandwidth compared to microwave.14–18 Highly stabilized THz radiation sources are of great importance for the various applications mentioned above. Among different THz radiation sources, the electrically pumped THz quantum cascade laser (QCL), showing high output power,19 wide emission frequency range,20,21 high operation temperature,22–24 high-quality far-field beam,25,26 and narrow intrinsic linewidth,27 is an ideal candidate for high-precision frequency comb operation.28,29 Although the intrinsic linewidth of THz QCLs is narrow, the practical devices normally show broad linewidths due to the disturbances such as temperature drift, current variation, optical feedback and other environmental noises. So far, many efforts have been devoted to improving the stability of THz QCLs. Danylov et al. employed an analog circuit to lock the beatnote signal between a 2.308-THz QCL and a local optically pumped molecular THz laser to a microwave local oscillator (LO), increasing the long-term stability of the THz QCL.30 Freeman et al. injection locked a QCL emitting around 2 THz to a difference frequency generated by a pair of comb lines of a fiber-based near-infrared comb, and the intermode beatnote of the comb is referenced to a microwave source. Thus, the linewidth of the locked QCL is reduced to the linewidth of the microwave reference, which is .31 Similarly, many efforts have been put on locking a single-mode QCL to a reference standard.32–42 In addition, a large amount of work has been done to stabilize THz QCL frequency combs by locking the repetition frequency and/or carrier envelope offset frequency .43–50 All the above-mentioned techniques require complex experimental facilities with a highly stable THz LO. Furthermore, the evaluation of the frequency stability of THz QCLs is still challenging. For instance, even though the frequency noise power spectral density (FNPSD) can provide precise evaluation of the laser stability,27,51 the setup to achieve FNPSD is relatively complex and in need of a proper discriminator.
In this work, we propose a simple method, i.e., a relative phase-locking scheme, to evaluate the stability of THz QCLs without a need for a THz LO. The laser system is configured with a THz QCL frequency comb and a single-mode QCL. The emission of the comb laser is injected directly onto the front facet of the single-mode laser, and the single-mode laser is used as a photodetector (or mixer) to obtain the current signal resulting from multiheterodyne beatings of the two lasers. To implement the relative phase locking, the heterodyne signal is sent to a phase-locked loop (PLL) module to generate the error signal for phase locking. Two kinds of phase locks, by either controlling the drive currents of the single-mode QCL or the QCL comb, are implemented. By analyzing the current (or frequency) change of the locked QCL in each case, we are able to compare the stability of the two lasers.
Sign up for Advanced Photonics Nexus TOC. Get the latest issue of Advanced Photonics Nexus delivered right to you!Sign up now
2 Relative Phase-Locking Scheme
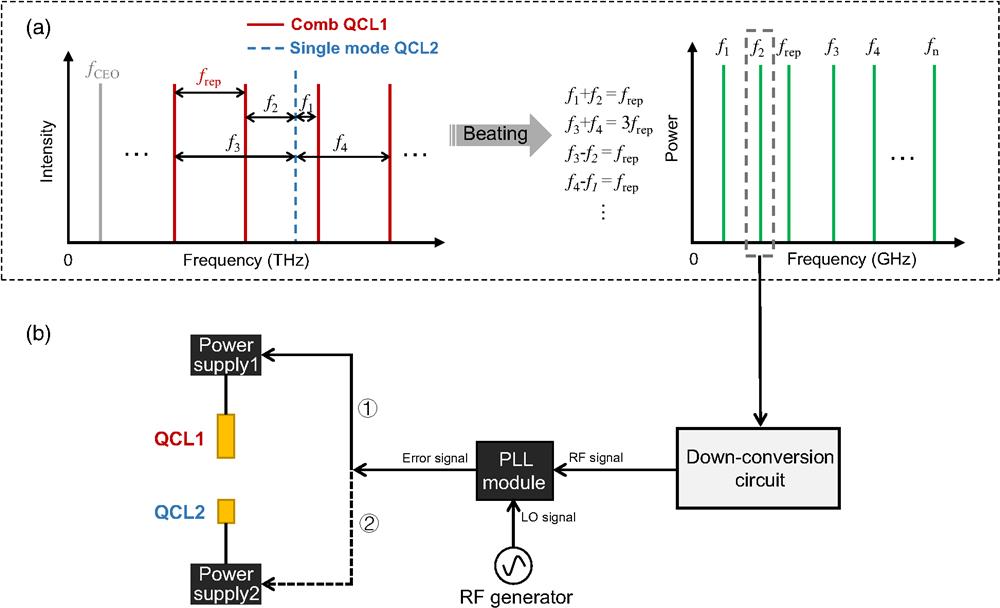
The relative phase-locking scheme is shown in Fig. 1. Two THz QCLs, i.e., comb QCL1 (red solid lines) and single-mode QCL2 (blue dashed line), are employed in this scheme. The leftmost gray line in Fig. 1(a) refers to of the comb QCL1 with a repetition frequency of . Each frequency of the comb lines can be fully defined as , where is the line order of a comb line. represents the emission frequency of the single-mode QCL2. When beats with different comb lines, the corresponding heterodyne beating signals, , are generated, as shown in Fig. 1(a). It is worth noting that heterodyne signal is the frequency difference between and , and it is located in the microwave frequency range. Therefore, the traditional PLL can be employed to lock to a microwave LO. As shown in Fig. 1(b), one of the heterodyne signals, , is selected for the phase locking. To satisfy the bandwidth requirement of the PLL module, is further downconverted to . The error signal generated from the PLL is either sent to QCL1 (loop ①) or QCL2 (loop ②) for different locks. It is worth noting that the proposed scheme consists of locking one laser with respect to the other laser; no reference standard is used. Therefore, the locking is actually a relative phase locking rather than a complete locking of each laser. Although the relative phase locking is not able to firmly lock the THz lines of the two lasers, it is much easier to be implemented because a THz reference standard is not needed. Moreover, by employing the relative phase-locking scheme, one can retrieve and compare the instability of the two lasers.
Figure 1.Scheme of the proposed relative phase locking. (a) Frequency components in the THz (left panel) and microwave (right panel) frequency ranges. The red solid lines and blue dashed line represent the comb lines of QCL1 and the single emission line of QCL2 (), respectively. and denote the carrier envelope offset frequency and repetition frequency of QCL1. , , , and are the four lowest beating frequencies between and its neighboring comb lines of QCL1. In the right panel, the heterodyne signals and are shown by green lines. The formulas show the relations of these frequencies. (b) PLL scheme by selecting one of the heterodyne signals, . is downconverted to to satisfy the bandwidth requirement of the PLL module. RF generator is used to output an LO signal to mix with and generate the error signal for phase locking. In the circuit loops labeled ① and ②, the PLL error signal is fed back to QCL1 and QCL2, respectively.
It is worth noting that the experimental scheme shown in Fig. 1 is upgraded based on the laser beating scheme proposed in Ref. 52 for detecting the frequency tuning coefficient of a single-mode THz QCL. However, the two schemes are different in working principles and experimental implementations. First, in Ref. 52, both lasers are 6-mm long, while in this work, the cavity length of the single-mode laser is reduced to 2 mm for a better single-mode performance. Second, in this work, two QCLs are placed face to face on two arms of a -shape sample holder and the distance between the two laser facets is 20 mm, while in Ref. 52, the two lasers are fully separated and located in two different cryostats. Furthermore, the most important difference is that in the current work, we implement the relative phase locking onto the laser system, which allows the evaluation of the laser stability without the need for complex facilities and a stable THz LO.
By comparing the stability of or in two locking conditions, we are able to compare the stability of the two lasers. To make the comparison easier, the repetition frequency of the comb laser (QCL1), , is injection-locked. Therefore, we can directly evaluate the relative stability of the comb carrier frequency () and of the single-mode laser. The detailed process can be described as follows.
Following the representative scheme shown in Fig. 1(a), and can be written as where is the frequency of the LO used for the frequency downconversion RF1 in Fig. 2(a). Then, we introduce the frequency instability, which can be defined by . shows the time-dependent frequency fluctuation and all frequency components shown in Eqs. (1) and (2) will contribute to the total frequency instability. Hence, the instability of and can be expressed as
Figure 2.(a) Experimental setup. QCL1 with a dimension of is operated in the comb state and QCL2 with a dimension of is operated in the single-mode state. The light of QCL1 (orange) and QCL2 (blue) is coupled to the facets of each other to enable the heterodyne beating between the two lasers. Herein the heterodyne beating signals in the microwave frequency range are detected by QCL2 utilizing the self-detection method. The detected signals are extracted using a bias-T and then amplified and split into two: one is sent to the spectrum analyzer for observation and analysis; the other is downconverted by mixing with RF1, filtered, amplified for phase locking. Simultaneously, the signal is sent to a frequency counter for the frequency stability evaluation. RF2 serves as the LO signal of the PLL module to generate the error signal. Loop ① and ② represent locks with the error feedback to QCL1 and QCL2, respectively. RF3 is employed for the injection locking of QCL1 to stabilize its repetition frequency. (b) and (c) are curves of QCL1 and QCL2 measured in continuous-wave (CW) mode when the heat sink temperature is stabilized at 25 K. (d) Emission spectra of QCL1 and QCL2 measured using a Fourier transform infrared spectrometer. For the spectral measurements, QCL1 and QCL2 are, respectively, operated at drive currents of 1000 and 250 mA at 25 K.
It is worth noting that in this work the comb repetition frequency () is injection locked and RF1 is the LO frequency. Both frequencies are highly stable, and their instabilities can be neglected in the ideal case. Therefore, Eqs. (3) and (4) can be rewritten as It can be seen that the total instability results from two causes, i.e, comb carrier instability and single-mode laser instability.
Then, when the relative phase locking is implemented on , in an ideal phase-locking condition, no matter the PLL error signal is sent to QCL1 or QCL2, will be firmly locked to the LO signal of PLL [, see RF2 in Fig. 2(a)]. Because is generated from a highly stable RF source, for both phase locking of QCL1 and QCL2, we would not be able to see the difference in . Although in both PLL conditions are identical and demonstrate high stability as the LO signal (), the inner locking behaviors are different. For instance, when the error signal is fed back to QCL1 (loop ①), the working PLL forces the comb laser (QCL1) to follow the behavior of the single-mode laser (QCL2). In this case, Eq. (5) can be written as where refers to the frequency change of QCL1 resulting from the feedback current control because of the PLL implementation. is stable and its instability can be neglected, i.e., . Therefore, from Eq. (6), we can conclude that when the PLL is implemented on QCL1, the instability of the single-mode laser () is equal to the measured frequency change of the comb laser (). And can be experimentally obtained by measuring the current change and tuning coefficient () of QCL1 during the phase-locking process. Finally, we can evaluate the single-mode laser instability by performing PLL on the comb laser (QCL1) and can be estimated as
Similarly, when loop ② is activated (the PLL is implemented on QCL2), the instability of the comb laser (QCL1) with the repetition frequency being injection locked can be written as where is the frequency change of QCL2 resulting from the feedback current control because of the PLL implementation, and are the current change and frequency tuning coefficient, respectively, of QCL2 during the phase-locking process.
Based on the above analysis, we can compare the instability of the single-mode laser and the comb laser by implementing relative phase-locking experiments.
3 Experimental Setup and Laser Performance
The experimental setup of the relative phase locking presented in Fig. 1 is shown in Fig. 2(a). The comb laser (QCL1) and the single-mode laser (QCL2) employed in this experiment are both based on a hybrid active region design that exploits the bound-to-continuum transition for THz photon emission and resonant phonon scattering for achieving the population inversion. The entire active region of the QCL based on multiquantum-well structures53,54 was grown on a semi-insulating GaAs substrate using the molecular beam epitaxy technique. Then the grown wafer was processed into a single plasmon waveguide configuration. Finally, the annealed laser bars with different cavity lengths were cleaved and mounted on copper heat sinks for characterizations. It is worth noting that for QCL1, an optimal ridge width of and a cavity length of 6 mm are adopted because the two dimensions have been proved to be more favorable for frequency comb operation.18,47,55 For QCL2, to obtain a stable single-mode operation, a cavity length of 2 mm is used. This is because a shorter cavity results in a larger free spectral range (FSR) or a larger mode spacing. Given an identical gain bandwidth, it is much easier for short cavity lasers to obtain single-mode operation around the laser threshold. According to the mode analysis of single-plasmon waveguide QCLs with a same active region structure,55 the fundamental transverse mode can be maintained for a laser ridge width of . Note that the lasing bandwidth of the QCL active region was measured to be larger than 300 GHz centered at 4.2 THz.54
For the heterodyne measurements, the two QCLs were screwed onto a -shape cold finger.18 Even though the coupling between two lasers would affect the emission of the two lasers, the effect is quite limited because the coupling is weak and only hundreds of nW power from one laser are finally injected into the other one. There are several advantages for this geometry. First of all, no optics and alignment are needed. Second, when the two lasers sit on the same cold finger, they actually share the same temperature and vibration noises, and these common noises can be canceled in the heterodyne measurements. Furthermore, when we compare the stability of two lasers, it would be fair to put them in the same physical environment, which is the case in our experiment. Due to the fast carrier relaxation time (picosecond-level) of QCLs, in this work QCL2 is used as a fast THz detector (or mixer) to obtain the current signal resulting from the beatings between QCL1 and QCL2. Finally, the current spectrum is registered on a spectrum analyzer for real-time visualization.18,56 As shown in Fig. 2(a), the microwave signal is first transmitted through a microstrip line mounted close to QCL2 and then extracted by a bias-T. After the bias-T, the signal is amplified and split into two: one is used for spectral measurements; the other is downconverted, filtered, and amplified for the relative phase locking. The error signal of the PLL is transferred to current, which is added to the direct current (DC) of the QCL, and the added up current is then applied to the QCL. All these are implemented using a power module of the PLL (ppqSense S.r.l, QubeCL). As we elaborated in Fig. 1, two kinds of locking are proposed to compare the stability of the two lasers. Loop ① and loop ② represent the feedback controls to QCL1 and QCL2, respectively. Note that in the experiment, the comb laser (QCL1) is injection-locked to stabilize its repetition frequency.
Figures 2(b) and 2(c) show the measured light-current-voltage () characteristics of QCL1 and QCL2, respectively, recorded in CW mode at a stabilized temperature of 25 K. The current oscillations around 6 V observed in the curves correspond to the negative differential resistance of the lasers, which can be clearly seen when the power supply is operated in a constant voltage mode. The CW power is measured using a THz power meter (Ophir, 3A-p THz) from one single facet without any corrections for water absorption, window transmission, mirror reflections, etc. Although the two lasers have different dimensions, they both can output a maximum power of 1.5 mW. The typical emission spectra of the two lasers are shown in Fig. 2(d). To operate QCL1 as a comb and QCL2 as a single-mode emission, the drive currents of the lasers are set 1000 and 250 mA, respectively (see Fig. S1 in the Supplementary Material for the intermode beatnote mapping of QCL1). As expected, the single-frequency line of QCL2 is located in the comb spectral range of QCL1, which is essential for the heterodyne measurements proposed in this experiment.
4 Results and Discussion
To verify the heterodyne beating scheme shown in Fig. 1, we show the measured beatnote signals in Fig. 3. The intermode beatnote frequency of the comb laser is measured to be 6.064963 GHz, with a power of , as shown by the black spectrum in Fig. 3. Multiple beatnote signals, i.e., to , resulting from the beats between QCL1 and QCL2 can be clearly observed. The frequencies of the recorded beatnote signals can basically satisfy the mathematical relationships mentioned in Fig. 1(a), which proves that the signals are indeed generated from the multiheterodyne beatings between the different comb lines of QCL1 and the single-frequency line of QCL2. The results shown in Fig. 3 directly indicate that the detection bandwidth of the single-mode laser (QCL2) can reach (). Compared to the experimental results shown in Ref. 52, where a 6-mm long QCL operated in single mode demonstrates a detection bandwidth of 15.3 GHz, the 2-mm long QCL in this work shows a far broader bandwidth. It can be explained as follows. As the laser cavity length is shortened, the response time of the laser as a detector becomes faster, and therefore, it demonstrates a much wider bandwidth than that of long cavity device.
Figure 3.Measured intermode beatnote of QCL1 and heterodyne signals resulting from the beating between QCL1 and QCL2. A resolution bandwidth (RBW) of 1 kHz and a video bandwidth (VBW) of 200 Hz are used for the beatnote measurements. QCL1 and QCL2 are operated at 950 and 275 mA, respectively, at a heat sink temperature of 26.5 K.
In Fig. 3, the multiheterodyne beating scheme between QCL1 and QCL2 is experimentally proved. To implement the relative phase locking, one of the heterodyne beating signals, i.e., , is selected. To make the stability comparison simpler, in this work the repetition frequency of the comb laser (QCL1) is injection-locked by a stabilized microwave signal at 6.06365 GHz with a power of . A relatively low RF power is applied to maximally suppress the noise of the RF synthesizer, which normally presents large phase noise at a high RF power.57 In Fig. 4(a), we show the “maxhold” traces of the intermode beatnote of QCL1 when the RF injection is on and off. Here, the maxhold function of the spectrum analyzer can store the spectra maxima for a given measurement duration, which can directly evaluate the long-term frequency stability of a signal. It can be seen that for a 10-s measurement time, the free-running intermode beatnote (without RF injection) shows a maxhold linewidth of 19 kHz, while, as the RF injection is applied, the linewidth is significantly reduced and locked to be identical as the RF synthesizer. It verifies that the term can be neglected when the intermode beatnote is RF injection-locked, as demonstrated in Sec. 2. It is worth noting that the signal that we measured with RF injection shown in Fig. 4(a) consists of two contributions: one is the intermode beatnote and the other is the signal directed from the RF source. However, this is not a problem in this experiment. If the intermode beatnote of the comb laser is not locked to the RF source, the superposition of the two signals will result in a broad pedestal at a power level of [see the dashed curve in Fig. 4(a)]. However, as shown in Fig. 4(a), the broad pedestal is not observed, which indicates that the intermode beatnote is injection-locked to the RF source. In Figs. 4(b) and 4(c), we further show maxhold traces of the heterodyne beatnote without RF injection and with RF injection, respectively, for a time duration of 30 s. From RF off to RF on, we can observe a maxhold linewidth reduction of from 4.4 to 3.6 MHz. From Fig. 4, we can see the RF injection can improve the stability of . However, the locking effect on is not as strong as that on the intermode beatnote signal. This shows that although the repetition frequency of QCL1 is locked, and are still moving and therefore we observe a relative large maxhold linewidth of , even as the RF injection locking is implemented.
Figure 4.(a) Maxhold traces of unlocked (black dashed line) and locked (blue solid line) intermode beatnote of QCL1. The RBW and VBW of the spectrum analyzer are set as 500 and 50 Hz, respectively. QCL1 and QCL2 are driven at 960 and 275 mA, respectively, at 25 K. (b) Maxhold trace of heterodyne beatnote measured using an RBW of 10 kHz and a VBW of 500 Hz when the RF injection is off. (c) Maxhold trace of heterodyne beatnote measured using an RBW of 10 kHz and a VBW of 500 Hz when the RF injection is on. In (b) and (c), QCL1 and QCL2 are operated at 960 and 275 mA, respectively, at 24.2 K.
In Fig. 5, we show the results of the proposed relative phase locking of , which is downconverted from to to satisfy the PLL requirement. In the phase-locking experiment, the RF injection locking is always applied onto the comb laser. Figure 5(a) shows the maxhold trace of for 30 s without PLL. The measured maxhold linewidth of 3 MHz shows a good agreement with the result measured for [see Fig. 4(c)]. It is worth noting that the 600 kHz difference between the two measurements is relatively small when the PLL is off. This is because the results of Figs. 4(c) and 5(a) are not recorded at the same time, the operation temperatures for the two measurements are not same, and the environmental noises are not identical for both measurements. Figures 5(b) and 5(c) show the phase-locked spectra obtained by sending the error signal either to QCL1 or to QCL2, respectively. The LO signal of the PLL module is set as 98 MHz. We can clearly see that for a time duration of 30 s, the locked signal, , at 98 MHz for both cases demonstrates ultrahigh stability. The observed servo bumps next to the narrow peak at 98 MHz in each case can prove that the phase locking works well. Note that in Figs. 5(b) and 5(c), we can observe some side peaks. The side peaks are not equally spaced, and they randomly appear and disappear during measurements (see Videos 1 and 2 in the Supplementary Material). Therefore, we assume that the side peaks may result from mechanical vibrations or other environmental noises. Figure 6 shows the screenshots of Videos 1 and 2.
Figure 5.Maxhold traces of mesured in a time duration of 30 s under three laser operation conditions recorded using an RBW of 2 kHz and a VBW of 500 Hz. (a) RF injection is switched on and PLL is switched off. (b) Both RF injection and PLL are switched on, and the error signal of PLL is fed back to QCL1. (c) Both RF injection and PLL are switched on, and the error signal of PLL is fed back to QCL2. For the measurements, QCL1 and QCL2 are driven at 960 and 275 mA, respectively, at 25 K.
As we elaborated in Sec. 2, once the phase-locking circuit works ideally, no matter what PLL feedback is sent to QCL1 or QCL2, the locked signal, , will be firmly locked to the LO signal and the LO’s linewidth is then transferred to [see Eq. (6)]. In Fig. 7, we show the phase noise spectra and high-resolution beatnote spectra of for the two different phase-locking configurations. It can be seen from Fig. 7(a) that the phase noise is almost identical for both PLL measurements. The two curves both begin at 10-Hz offset from the carrier with the phase noise around and show the same tendency during the entire offset frequency range up to 10 MHz. The phase noise spectra are measured by employing the phase noise module (K40) of the spectrum analyzer. In this measurement, if the signal is stabler, the measurable starting offset frequency is lower. The low measurable starting frequency of 10 Hz refers to a high stability of the signals. Figure 7(a) experimentally shows that the locked possesses the same stability, no matter whether the error signal is fed back to QCL1 or QCL2. Furthermore, in Figs 7(b) and 7(c) we show the high-resolution beatnote spectra of for the PLL feedback to QCL1 and QCL2, respectively, using a resolution bandwidth (RBW) of 1 Hz. One can clearly see that the measured signal-to-noise ratio (SNR) for both signals is 35 dB, which further indicates that the both locks work well, and locked signals demonstrate identical frequency stability.
Figure 7.(a) Phase noise spectra of measured when the error signal is fed back to QCL1 (red curve) and QCL2 (black curve). (b) and (c) are high resolution phase locked spectra of obtained by sending the error signal to QCL1 or QCL2 recorded using an RBW of 1 Hz.
Based on the analysis in Sec. 2 and experimental results shown in Fig. 7, it is impossible to compare the stability of the two QCLs by evaluating the locked . Although the two locked demonstrate identical stabilities, the efforts taken to ideally lock the two signals are different. It can also be seen in Fig. S2 in the Supplementary Material that the fluctuations of the phase error in two conditions are different. Therefore, we can estimate the frequency instability of QCL1 and QCL2 by analyzing the dynamical locking processes of the two different phase locks. This can be explained in detail as follows. When the feedback control is applied onto QCL1, we actually change the current of QCL1 to change its frequency to follow the frequency shift of QCL2. In the dynamic process, the heterodyne beating signal between QCL1 and QCL2, i.e., , is unchanged (locked). Therefore, the measured current change of QCL1 can be transferred to the frequency change of QCL1, which actually characterizes the frequency instability of QCL2; see Eq. (7). On the other hand, when the PLL feedback works on QCL2, the frequency change of QCL2 that we measured during the locking process gives the frequency instability of QCL1; see Eq. (8).
To retrieve the frequency instability, i.e., and , for QCL1 and QCL2, respectively, we first measure the current tuning coefficients of the two lasers and the current changes during the two different phase-locking processes. Taking advantage of the method proposed in Ref. 52, we can measure the current tuning coefficient of QCL1 and QCL2 precisely. Figure 8(a) shows that decreases when the drive current of QCL1 increases from 960 to 961 mA with a step of 0.2 mA. We can then obtain the current tuning coefficient of QCL1 which is . In Fig. 8(b), we show the drive current change of QCL1 (green dots) in a time duration of 40 s under the phase-locked condition. It can be seen that during the locking process, the current change of QCL1 can vary from to 1.6 mA with a span of 3.2 mA, which is far larger than the current change of 1 mA shown in Fig. 8(a). Considering the mismatch between the current changes shown in Figs. 8(a) and 8(b), we plot the frequency change of QCL1 (red dots) within the current change of 1 mA for the right axis in Fig. 8(b). From the frequency tuning measurement in Fig. 8(a), we cannot obtain the tuning coefficient, as the current change is larger than 1 mA. However, the results shown in Fig. 8(b) can ensure that the frequency change is larger than 4.9 MHz. Therefore, we can conclude that the frequency instability of QCL2 is larger than 4.9 MHz, i.e., , for a time duration of 40 s.
Figure 8.(a) Frequency tuning of QCL1 when the drive current is changed from 960 to 961 mA with a step of 0.2 mA. The arrow shows the current increase direction. The tuning coefficient is derived to be . (b) Current change of QCL1 (green dots, left axis) when the error signal of PLL is fed back to it and the corresponding frequency change (red dots, right axis) within 1 mA. (c) Frequency tuning of QCL2 when the drive current is changed from 275 to 276 mA with a step of 0.2 mA. The arrow shows the current increase direction. The tuning coefficient is . (d) Current change of QCL2 (left axis) when the error signal of PLL is fed back to it and the corresponding frequency change (right axis). It is worth noting that in (b) and (d) the current values of the left axes are offset by the mean value of the recorded maximum and minimum currents.
In Figs. 8(c) and 8(d), we show the measured frequency tuning and the current change of QCL2, respectively, when the error signal is fed back to QCL2. As the drive current of QCL2 is increased from 275 to 276 mA with a step of 0.2 mA, increases with a frequency change of 16.2 MHz. It can be seen from Fig. 8(c) that an opposite direction of frequency shift is observed compared to the result shown in Fig. 8(a). Actually, this can be clearly explained by analyzing the scheme shown in Fig. 1(a). When the current of QCL1 increases, the THz modes of the comb will shift to higher frequencies (blueshift), which then results in a decrease of . On the other hand, as the current of QCL2 increases, shifts to higher frequencies (blueshift) and then an increase of is observed. From Fig. 8(c), a current tuning coefficient of QCL2, i.e., , can be obtained. It is worth noting that the tuning coefficient of QCL2 is far larger ( times larger) than that of QCL1, which is due to the difference in device dimensions. The single-mode laser (QCL2) with a cavity length of 2 mm is 3 times smaller than the comb laser (QCL1) with a cavity length of 6 mm. Therefore, the current in QCL2 is scaled down by 3 times, which makes QCL2 more sensitive to the current change. Figure 8(d) shows the recorded current change of QCL2 in a time duration of 40 s under the phase-locked condition. During the process, one can see the current change varies from to 0.07 mA with largest span of 0.14 mA. Because the current change of 0.14 mA is within the range of current change of 1 mA employed for the tuning characterization [Fig. 8(c)], we can safely conclude that the frequency change of QCL1 is under the phase-locked condition. The measurement also indicates that the frequency instability of the comb laser (QCL1) with the repetition frequency locked is , i.e., , for a time duration of 40 s. From the measured results shown in Fig. 8, one can clearly see that the comb laser (QCL1) with the repetition frequency locked is stabler than the single-mode laser (QCL2), and the frequency instability of the lasers for a time duration of 40 s is directly measured, i.e., and . We have to emphasize that the optical LO working in the THz frequency range is rare, and in this work, no THz frequency standard is used. Although we perform the relative phase locking and the THz lines are not firmly locked, the presented locking scheme with two different configurations allows us to quantitatively evaluate the long-term stability of the injection-locked comb laser and single-mode laser by analyzing the current (or frequency) changes of two QCLs under different phase-locked conditions. Note that we, in principle, can also do the phase locking without the RF injection locking. As shown in Eqs. (3) and (4), if the repetition frequency of the comb laser is not injection-locked, all three frequencies, i.e., , , and , will contribute to the instability of or . Therefore, will be much noisier, which makes the implementation of the PLL more difficult or even results in a failure of the phase locking.
It is worth noting that from our experimental results, the comb laser with the repetition frequency-locked shows much higher stability than the single-mode laser. This can be understood as follows. First of all, for semiconductor lasers, the cavity FSR noise is the main noise source. In the current experiment, the FSR of the comb is locked using microwave injection locking. Therefore, the main noise of the comb laser is suppressed. However, for the single-mode laser, the cavity perturbation still exists. Therefore, we observed that the comb laser with locked is stabler than the single-mode laser. On the other hand, the device geometry difference between the two lasers is the cavity length, i.e., 6 and 2 mm for QCL1 and QCL2, respectively. Generally speaking, for the longer cavity laser, the refractive index is more insensitive to environmental noises. Moreover, in this work, when the PLL is performed with feedback to the single-mode laser, the comb laser, in principle, can be regarded as an optical reference. Since the comb laser is stabler, the single-mode laser is forced to follow the comb laser and the frequency stability of the single mode is improved. Therefore, the relative locking technique is an effective method to stabilize a single-mode laser, which can be further used in some applications where a long-term frequency stability is required, e.g., low pressure gas sensing, linewidth measurements, etc.
5 Conclusion
In summary, we have experimentally demonstrated a simple method, i.e., a relative phase-locking scheme, to evaluate and compare the stability of a single-mode QCL and a comb QCL (with the repetition frequency-locked) emitting in the THz frequency range. The beatnote signals resulting from the multiheterodyne beatings between the single-mode QCL and comb laser were successfully obtained using the laser self-detection technique. The stability of the locked heterodyne beating signals with PLL feedback to the single-mode laser or the comb laser was investigated. The experimental results demonstrated that in terms of maxhold linewidth, phase noise, and SNR, the locked signal with feedback to either single-mode laser or comb laser showed the same stability. By analyzing the current (or frequency) changes under the two phase-locked conditions, the proposed relative phase-locking technique can quantitatively retrieve the long-term instability of the two lasers, i.e., and . The relative phase locking provides an easy and effective method to improve the stability of single-mode THz QCLs under the present circumstance, where the THz frequency reference (LO) is rare, which can be further implemented for spectroscopic applications.
Acknowledgment
Acknowledgment. This work was supported by the National Natural Science Foundation of China (Grant Nos. 62235019, 61875220, 61927813, 62035005, 61991430, and 62105351), the “From 0 to 1” Innovation Program of the Chinese Academy of Sciences (Grant No. ZDBSLY-JSC009), the Scientific Instrument and Equipment Development Project of the Chinese Academy of Sciences (Grant No. YJKYYQ20200032), the CAS Project for Young Scientists in BasicResearch (Grant No. YSBR-069), the National Science Fund for Excellent Young Scholars (Grant No. 62022084), the Shanghai Outstanding Academic Leaders Plan (Grant No. 20XD1424700), and the Shanghai Youth Top Talent Support Program. The authors have no conflicts to disclose.
Wen Guan received her bachelor’s degree from Hefei University of Technology in 2018. Currently, she is a PhD student at Shanghai Institute of Microsystem and Information Technology, Chinese Academy of Sciences. She is engaged in the research of terahertz multiheterodyne measurements and analysis.
Ziping Li received his PhD from Shanghai Institute of Microsystem and Information Technology (SIMIT), Chinese Academy of Sciences (CAS) in 2020. Subsequently, he completed his postdoctoral work at SIMIT, CAS. Currently, he is an associate professor at SIMIT, CAS. His research is focused on the terahertz laser-based frequency combs.
Shumin Wu is a PhD student at Shanghai Institute of Microsystem and Information Technology, Chinese Academy of Sciences. Her main research interest is the optical injection in THz QCLs.
Han Liu is a master’s student at Shanghai Institute of Microsystem and Information Technology, Chinese Academy of Sciences. She is currently engaged in the research of microwave transmission in terahertz quantum cascade laser frequency combs.
Xuhong Ma is a PhD student at Shanghai Institute of Microsystem and Information Technology, Chinese Academy of Sciences. His research interest is the stabilization of terahertz quantum cascade laser dual-comb sources.
Yiran Zhao is a PhD student at Shanghai Institute of Microsystem and Information Technology, Chinese Academy of Sciences. His research interest is the phase locking of terahertz frequency comb and dual-comb laser sources.
Chenjie Wang is a PhD student at Shanghai Institute of Microsystem and Information Technology, Chinese Academy of Sciences. He is currently engaged in the research of terahertz near-field by employing dual-comb sources.
Binbin Liu is a PhD student at Shanghai Institute of Microsystem and Information Technology, Chinese Academy of Sciences. Her research interest is the generation and applications of terahertz frequency combs.
Zhenzhen Zhang received her PhD from Shanghai Institute of Microsystem and Information Technology (SIMIT), Chinese Academy of Sciences (CAS) in 2018. Currently, she is an associate professor at SIMIT, CAS. Her research is focused on semiconductor-based terahertz devices and terahertz frequency combs.
Juncheng Cao received his PhD from Southeast University in 1994. He is a professor in Key Laboratory of Terahertz Solid-State Technology at Shanghai Institute of Microsystem and Information Technology, Chinese Academy of Sciences. His research group focuses on terahertz (THz) physics, semiconductor quantum devices and their applications in THz communication and imaging.
Hua Li received his PhD from Shanghai Institute of Microsystem and Information Technology (SIMIT), Chinese Academy of Sciences (CAS) in 2009. From 2009 to 2015, he worked at Technical University of Munich, University of Tokyo, and University Paris 7 as a postdoctoral research fellow. Since 2015, he has been with SIMIT, CAS as a professor. His research group focuses on physics, devices, and applications of semiconductor lasers, frequency comb, and dual-comb sources emitting in the terahertz frequency range.
Wen Guan, Ziping Li, Shumin Wu, Han Liu, Xuhong Ma, Yiran Zhao, Chenjie Wang, Binbin Liu, Zhenzhen Zhang, Juncheng Cao, Hua Li, "Relative phase locking of a terahertz laser system configured with a frequency comb and a single-mode laser," Adv. Photon. Nexus 2, 026006 (2023)