• Acta Optica Sinica
  • Vol. 41, Issue 13, 1306009 (2021)
Qian Zhang1、2, Tao Wang1、2, Jieru Zhao1, Jingyang Liu1, Jianzhong Zhang1、2, Lijun Qiao1、2, Shaohua Gao1、2, and Mingjiang Zhang1、2、*
Author Affiliations
  • 1Key Laboratory of Advanced Transducers and Intelligent Control System, Ministry of Education and Shanxi Province, Taiyuan University of Technology, Taiyuan, Shanxi 0 30024, China
  • 2College of Physics and Optoelectronics, Taiyuan University of Technology, Taiyuan, Shanxi 0 30024, China
  • show less
    DOI: 10.3788/AOS202141.1306009 Cite this Article Set citation alerts
    Qian Zhang, Tao Wang, Jieru Zhao, Jingyang Liu, Jianzhong Zhang, Lijun Qiao, Shaohua Gao, Mingjiang Zhang. Denoising Algorithm for Brillouin Optical Time-Domain Analysis Sensing Systems Based on Local Mean Decomposition[J]. Acta Optica Sinica, 2021, 41(13): 1306009 Copy Citation Text show less
    Experimental device diagram of the BOTDA sensing system
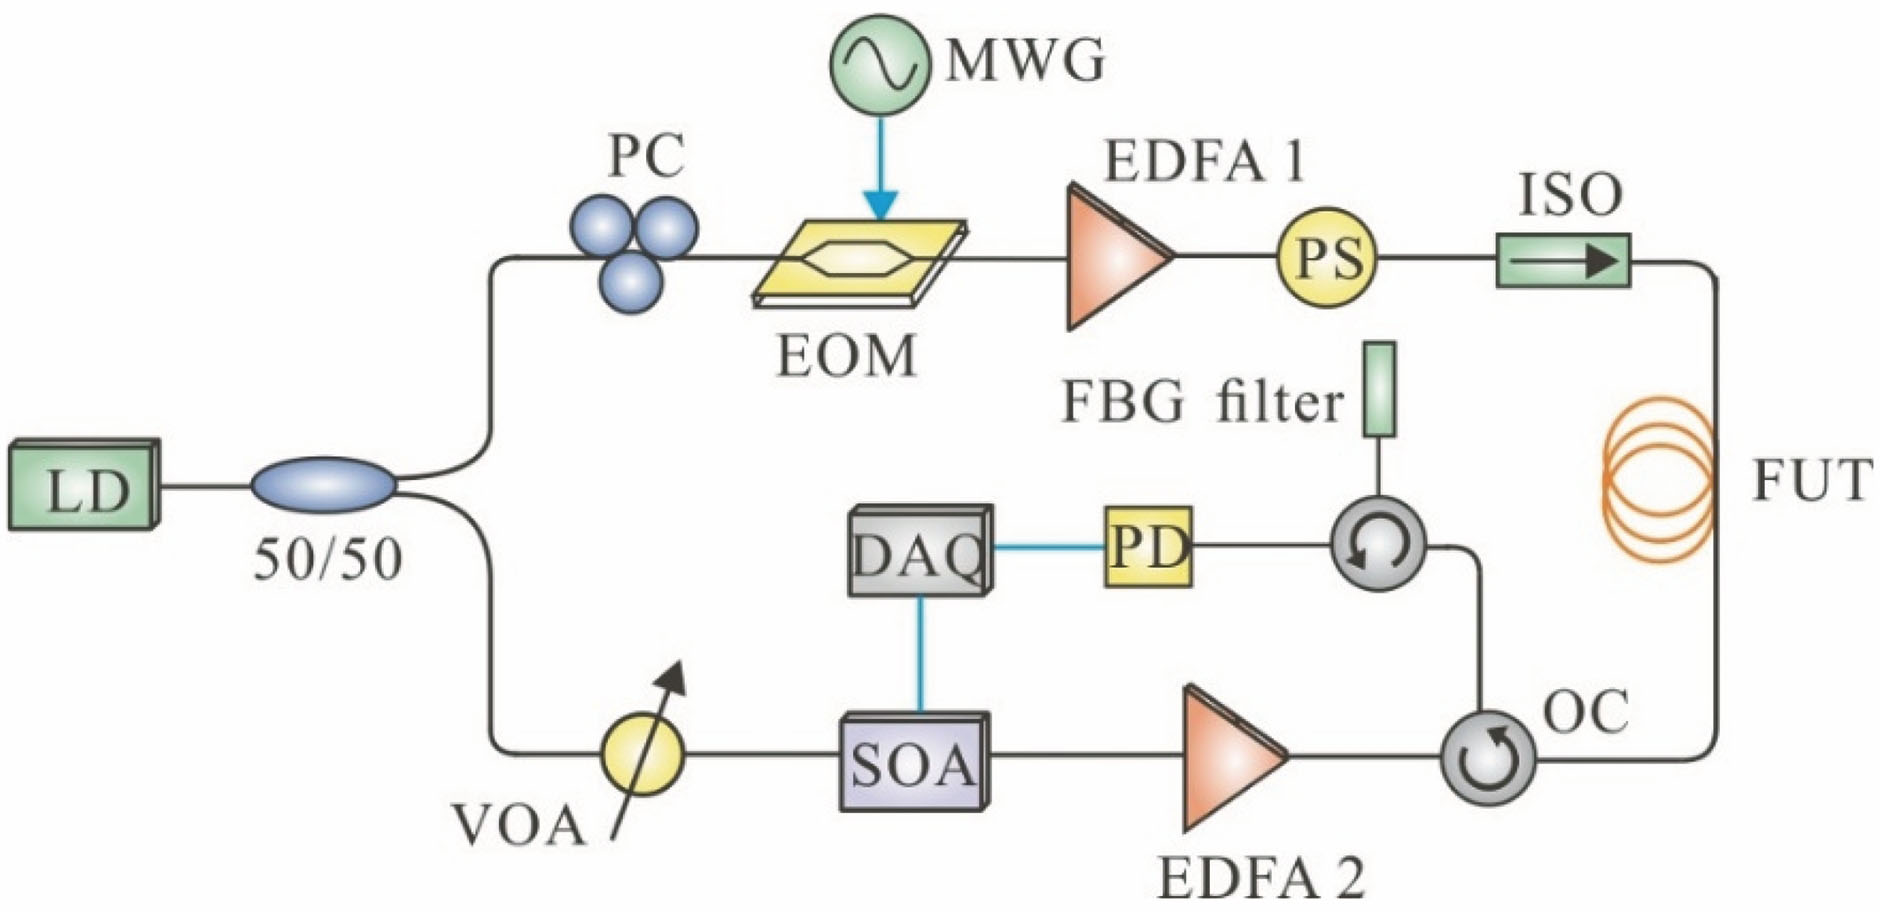
    Fig. 1. Experimental device diagram of the BOTDA sensing system
    Flow chart of the LMD noise reduction algorithm
    Fig. 2. Flow chart of the LMD noise reduction algorithm
    Decomposition results of the LMD algorithm
    Fig. 3. Decomposition results of the LMD algorithm
    Fourier transform spectra of different PF components
    Fig. 4. Fourier transform spectra of different PF components
    Residual component decomposed by LMD algorithm
    Fig. 5. Residual component decomposed by LMD algorithm
    Energy distributions of different PF components
    Fig. 6. Energy distributions of different PF components
    BOTDA signal before and after LMD algorithm noise reduction
    Fig. 7. BOTDA signal before and after LMD algorithm noise reduction
    Flow chart of optimized LMD noise reduction algorithm
    Fig. 8. Flow chart of optimized LMD noise reduction algorithm
    Filter curve of the Chebyshev I digital bandpass filter
    Fig. 9. Filter curve of the Chebyshev I digital bandpass filter
    Typical PF curves and spectra before and after filtering. (a) Timing curve before filtering; (b) spectrum curve before filtering; (c) timing curve after filtering; (d) spectrum curve after filtering
    Fig. 10. Typical PF curves and spectra before and after filtering. (a) Timing curve before filtering; (b) spectrum curve before filtering; (c) timing curve after filtering; (d) spectrum curve after filtering
    Time domain curve of BOTDA signal before and after optimized LMD algorithm for noise reduction
    Fig. 11. Time domain curve of BOTDA signal before and after optimized LMD algorithm for noise reduction
    Noise reduction results of the optimized LMD algorithm for different pulse widths. (a) 50 ns; (b) 70 ns; (c) 100 ns
    Fig. 12. Noise reduction results of the optimized LMD algorithm for different pulse widths. (a) 50 ns; (b) 70 ns; (c) 100 ns
    Change curves of signal SNR before and after noise reduction with the frequency of the probe light
    Fig. 13. Change curves of signal SNR before and after noise reduction with the frequency of the probe light
    SNR analysis at different probe light frequencies. (a) Signal amplitude; (b) noise variance; (c) SNR
    Fig. 14. SNR analysis at different probe light frequencies. (a) Signal amplitude; (b) noise variance; (c) SNR
    Frequency /GHz10.8010.8510.9010.9511.00
    EMD algorithm /s4.6427.3965.7967.4837.318
    LMD algorithm /s0.9221.1841.2001.0191.212
    Table 1. Running time of two algorithms
    Qian Zhang, Tao Wang, Jieru Zhao, Jingyang Liu, Jianzhong Zhang, Lijun Qiao, Shaohua Gao, Mingjiang Zhang. Denoising Algorithm for Brillouin Optical Time-Domain Analysis Sensing Systems Based on Local Mean Decomposition[J]. Acta Optica Sinica, 2021, 41(13): 1306009
    Download Citation