
Tao Zhang, Xijiang Chen. Bridge Amplitude Monitoring with Three-Dimensional Laser Scanning Technology[J]. Laser & Optoelectronics Progress, 2018, 55(5): 051409
- Laser & Optoelectronics Progress
- Vol. 55, Issue 5, 051409 (2018)
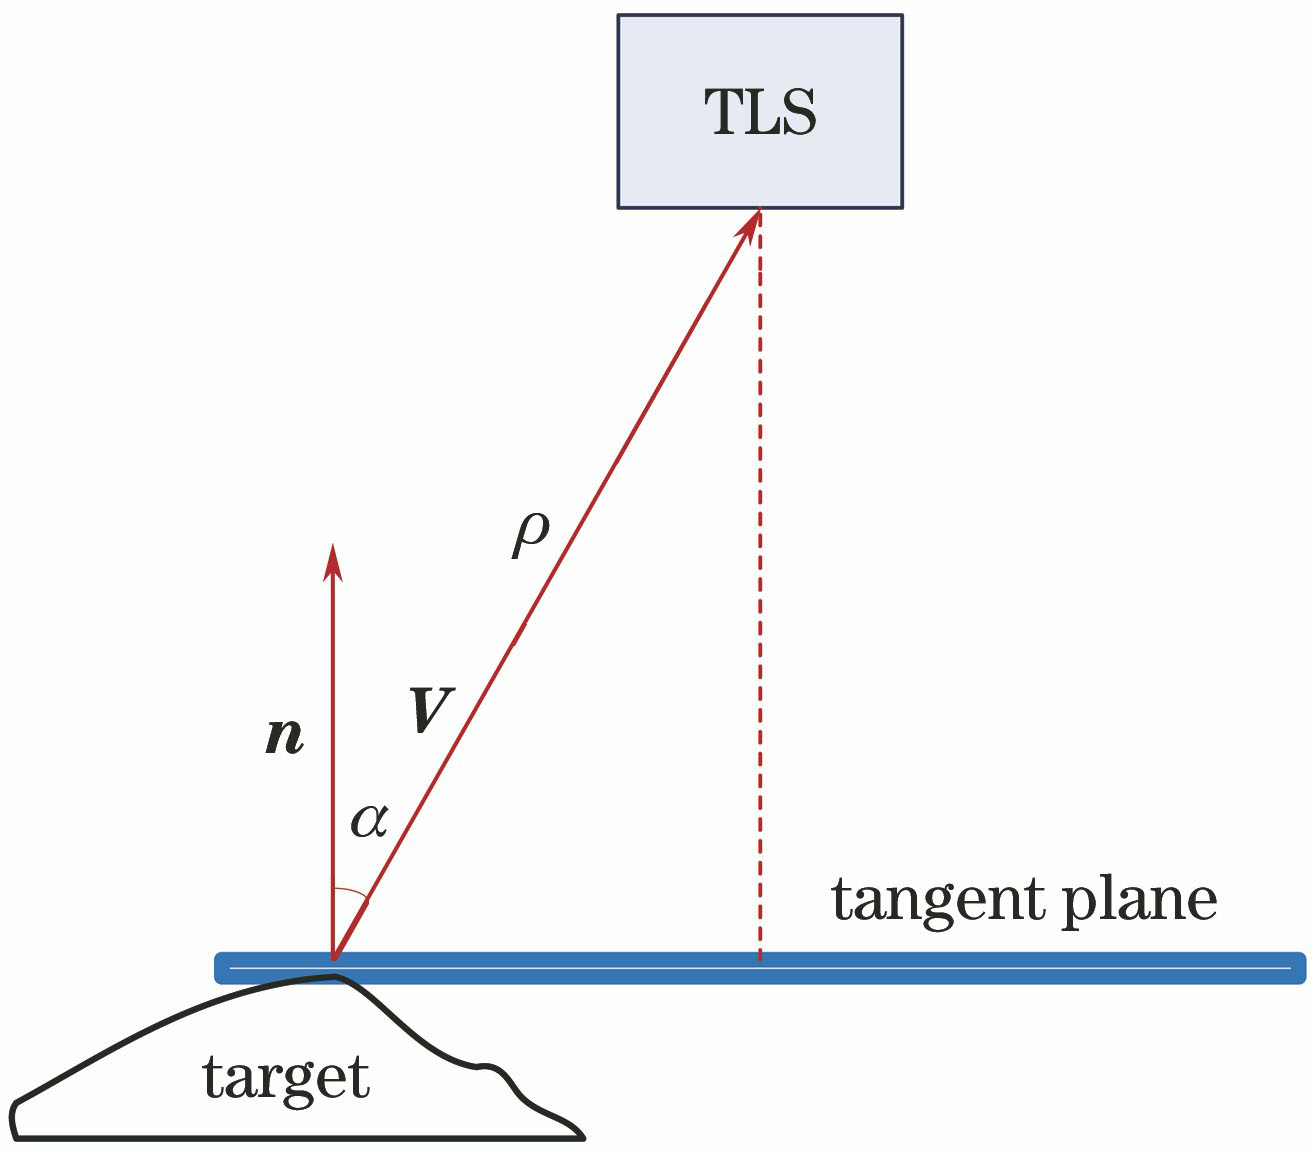
Fig. 1. Included angle between laser beam vector and normal vector of the surface of the object
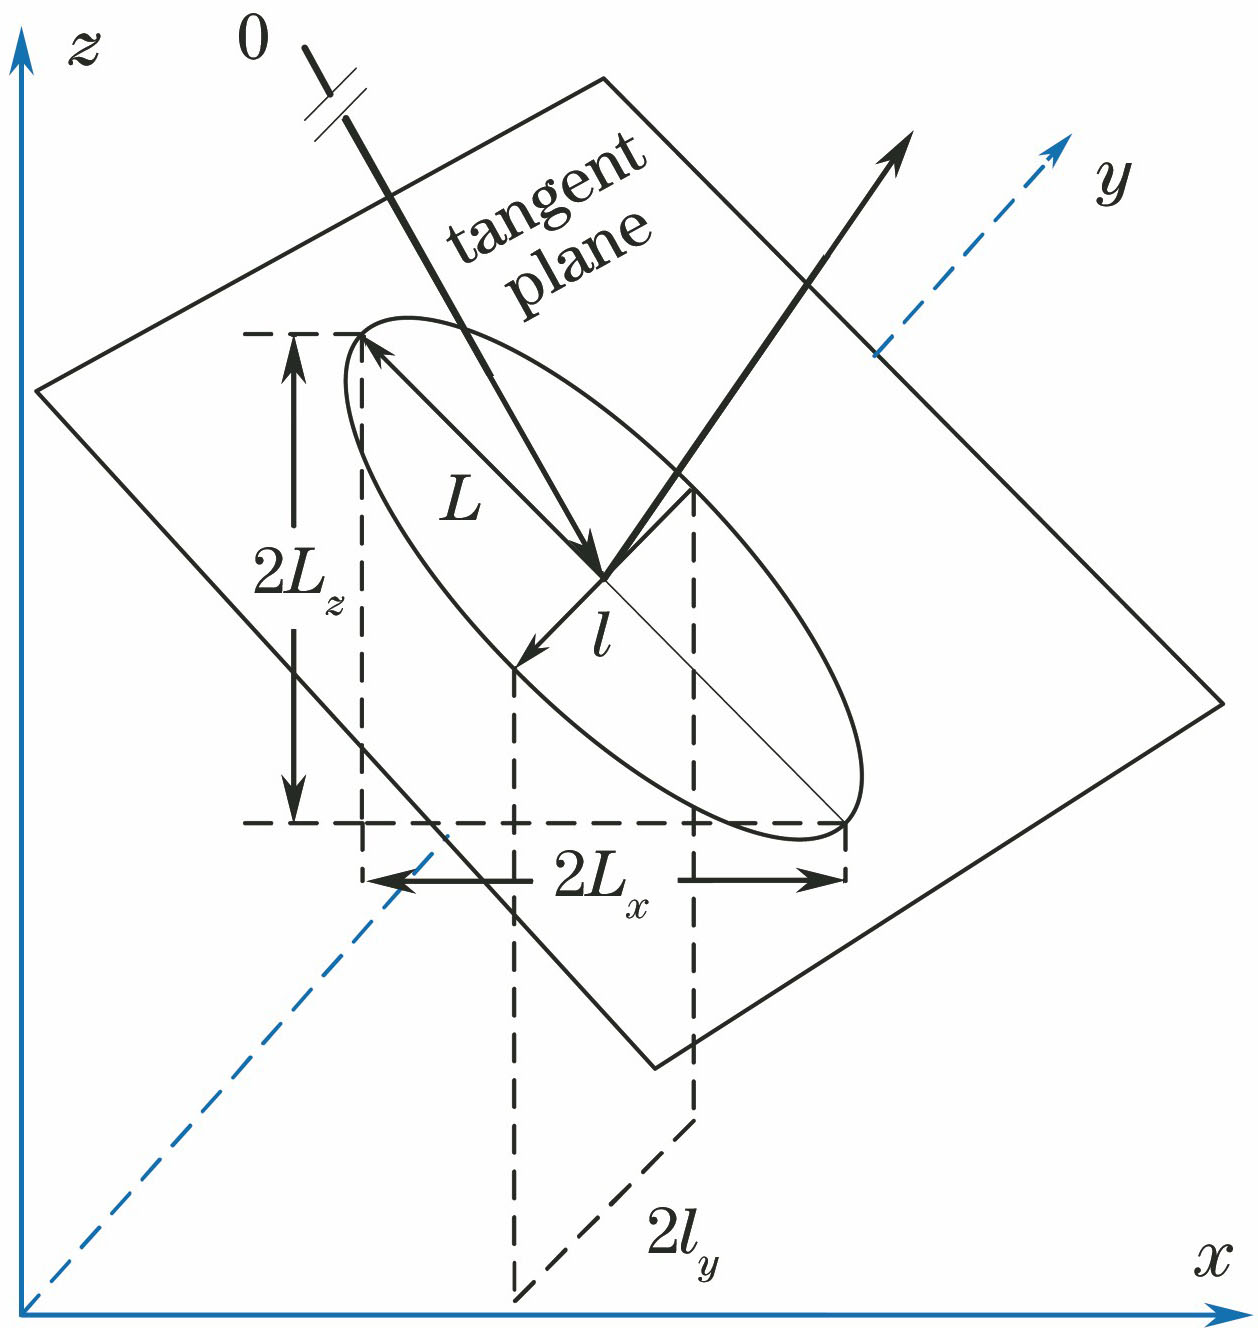
Fig. 2. Projection of semi-major axis and semi-minor axis of a laser spot on x, y, z coordinate
Fig. 3. Deformation simulator
Fig. 4. Deformation of different distances and incidence angles
Fig. 5. Histogram of point cloud error entropy. (a) Different distances; (b) different incidence angles
Fig. 6. Histogram of deformation monitoring indicators. (a) Different distances; (b) different incidence angles
Fig. 7. Ratio histogram of the number of extracted deformation points to the number of the total cloud points for all trials at different distances
Fig. 8. Ratio histogram of the number of extracted deformation points to the number of the total cloud points for all trials at different incidence angles. (a) 5°, 15°, 25° and 35°; (b) 45°, 55°, 65° and 75°
Fig. 9. Bridge site and schematic diagrams of the original point cloud data obtained by scanning
Fig. 10. Point cloud change of top part
Fig. 11. Point cloud change of upside part
Fig. 12. Point cloud change of middle part
Fig. 13. Point cloud change of right bottom part
Fig. 14. Point cloud change of left bottom part
Fig. 15. Point cloud change of stay-cables part
|
Table 1. Deformation monitoring indicators of different distances based on ratio of extracted deformation
|
Table 2. Deformation monitoring indicators of different incidence angles based on ratio of extracted deformation
|
Table 3. Deformation monitoring indicators of different regions

Set citation alerts for the article
Please enter your email address
© Copyright 2018-2021 | Chinese Laser Press. All Rights Reserved 沪ICP备15018463号-20