
Hai-jiang ZHU, Hao TANG, Jing-xian SUN, Zhen-xia DU. Classification Method of Liquor Quality Based on Time and Frequency Spectrum Characteristics[J]. Spectroscopy and Spectral Analysis, 2021, 41(9): 2962
- Spectroscopy and Spectral Analysis
- Vol. 41, Issue 9, 2962 (2021)
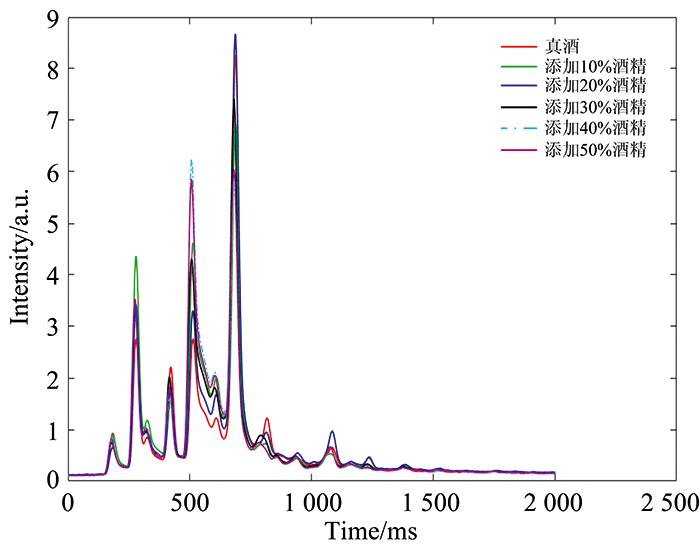
Fig. 1. The ion mobility spectra of real liquor and liquor with different proportion of alcohol
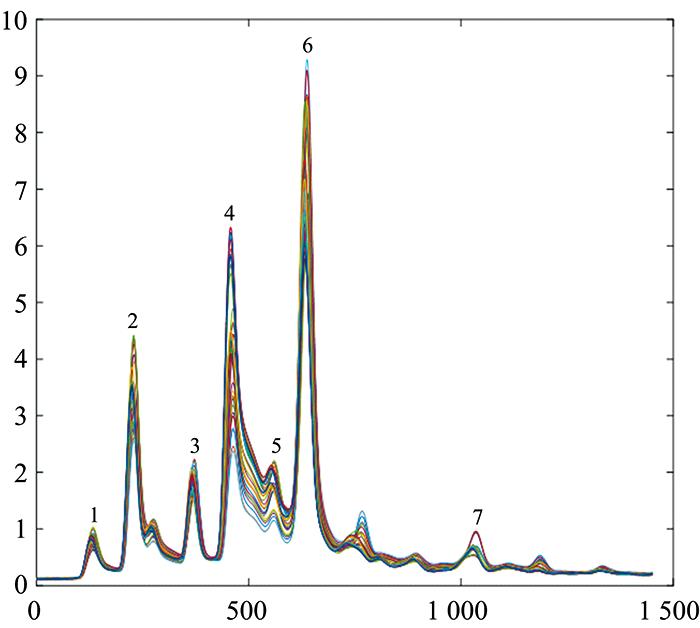
Fig. 2. The time domain characteristic peak
Fig. 3. The frequency domain response curve of ion mobility spectrum
Fig. 4. The spectral entropy time diagram of liquor samples
(a): Real liquor; (b): Liquor added with 10% alcohol; (c): Liquor added with 20% alcohol; (d): Liquor added with 30% alcohol; (e): Liquor added with 40% alcohol; (f): Liquor added with 50% alcohol
(a): Real liquor; (b): Liquor added with 10% alcohol; (c): Liquor added with 20% alcohol; (d): Liquor added with 30% alcohol; (e): Liquor added with 40% alcohol; (f): Liquor added with 50% alcohol
Fig. 5. The contribution rate of features after dimension reduction using PCA
Fig. 6. The contribution rate of features after dimension reduction using LDA
Fig. 7. The optimization results of parameter C in SVM binary classification experiment
Fig. 8. The optimization results of parameter gamma in SVM binary classification experiment
Fig. 9. The optimization results of parameter C in SVM six classification experiment
Fig. 10. The optimization results of parameter gamma in SVM six classification experiment
|
Table 1. The comparison of experimental results of classification methods
|
Table 2. The performance comparison of four classifiers
|
Table 3. The comparison of running time of four classifiers

Set citation alerts for the article
Please enter your email address
© Copyright 2018-2021 | Chinese Laser Press. All Rights Reserved 沪ICP备15018463号-20