
Yang XU, Lei LEI, Jun YAN, Yu-yun CHEN, Xue-cai TAN, Yu-qian LIU, Qi WANG. Determination of Glutaraldehyde in Water by Surface Enhanced Raman Spectroscopy Based on Metal Organic Framework Composite Substrate[J]. Spectroscopy and Spectral Analysis, 2022, 42(1): 115
- Spectroscopy and Spectral Analysis
- Vol. 42, Issue 1, 115 (2022)
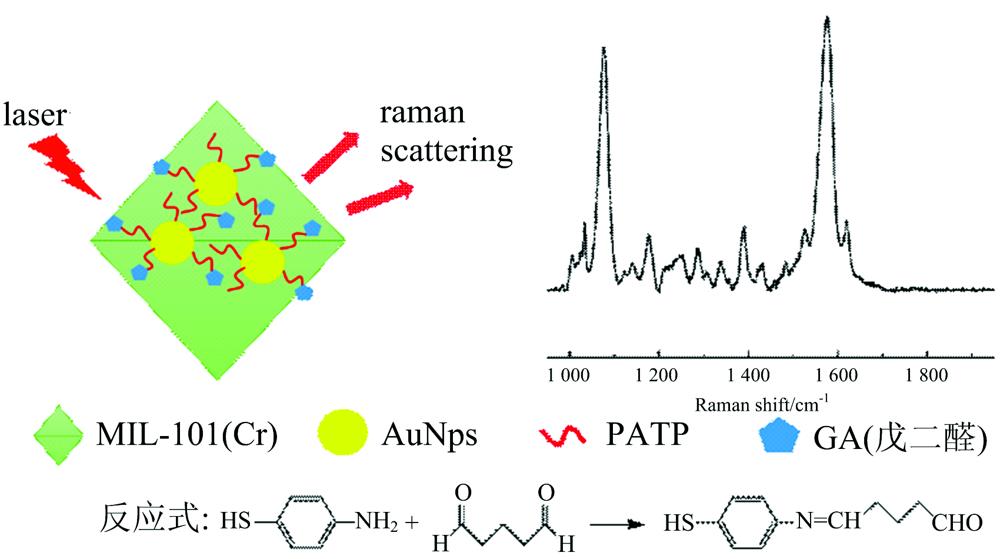
Fig. 1. Schematic diagram of Au@MIL-101/PATP detecting glutaraldehyde
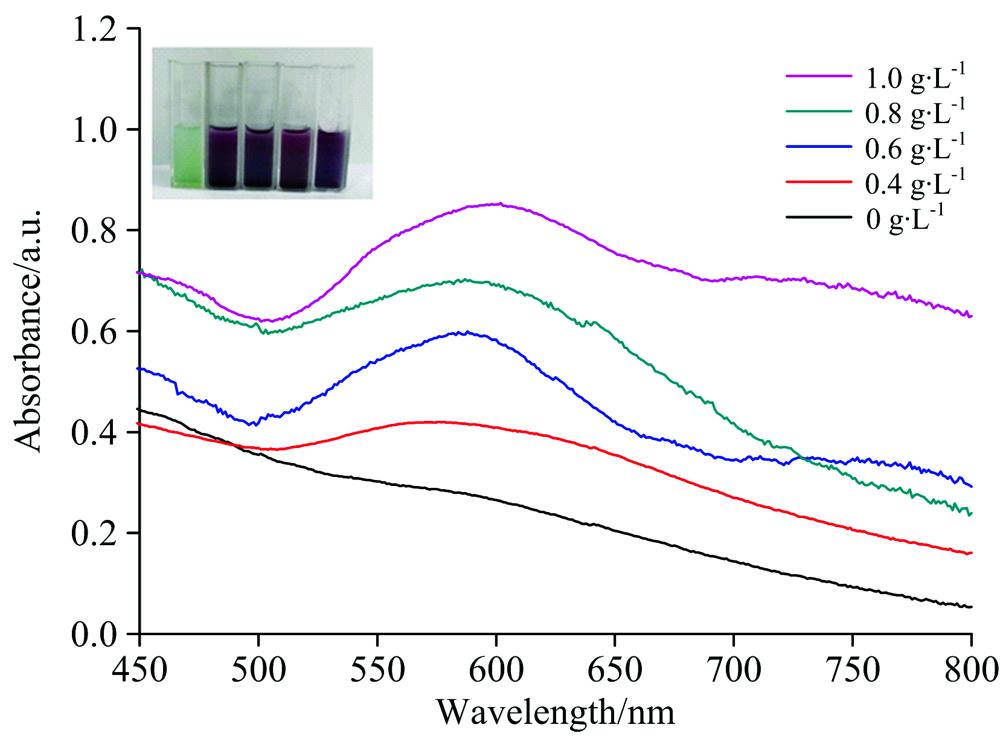
Fig. 2. The UV-Vis absorption spectra of Au@MIL-101 with different concentrations of chlorogenic acid. Inset shows the color change of material solutions
Fig. 3. Transmission scanning electron microscopy (TEM) of (A) MIL-101; (B)—(E) Au@MIL-101(The concentration of chloroauric acid is 0.4, 0.6, 0.8, 1.0 g·L-1); (F) the selected area electron diffraction pattern from the gold nanoparticles in Au@MIL-101
Fig. 4. (a) X-ray energy dispersive spectroscopy (EDS) of Au@MIL-101; (b) Powder X-ray diffraction pattern of MIL-101(Cr) and Au@MIL-101; (c) X-ray photoelectron spectroscopy of Au@MIL-101 and Au@MIL-101/PATP; (d) Binding energy peak of S
Fig. 5. (a) Raman spectra of PATP, glutaraldehyde and Schiff base; (b) Raman spectra of PATP and Au@MIL-101/PATP
Fig. 6. (a) Effects of different concentrations (0.4, 0.5, 0.7, 0.8, 1.0 g·L-1) of chloroauric acid and (b) different concentrations (0.01, 0.1, 1 mmol·L-1) of PATP on the enhancement effect
Fig. 7. Raman spectra of 10-4 mol·L-1 glutaraldehyde on (a) Au@MIL-101/PATP, (b) Au-PATP and (c) Au@MIL-101
Fig. 8. (a) SERS spectra of 10-5 mol·L-1 glutaraldehyde on composite substrate at different temperatures; Effect of experimental conditions on the intensities of SERS signals, including (b) temperature, (c) volume ratio of substrate and glutaraldehyde, (d) Catalysis of glacial acetic acid and reaction time
Fig. 9. (a) Uniformity of Au@MIL-101/PATP; (b) SERS detection of glutaraldehyde on different substrates under the same conditions; (c) Raman spectra of different aldehydes under the same test conditions
a —g : glutaraldehyde, formaldehyde, 5-hydroxymethylfurfural, acetaldehyde, glyoxal, benzaldehyde, acetone aldehyde
Fig. 10. (a) Relationship between the concentration of glutaraldehyde and the relative intensity of characteristic peaks; (b) SERS spectra of glutaraldehyde with different concentrations
|
Table 1. Detection and recoveries of glutaraldehyde in actual water samples at three spiked levels

Set citation alerts for the article
Please enter your email address
© Copyright 2018-2021 | Chinese Laser Press. All Rights Reserved 沪ICP备15018463号-20