• Acta Optica Sinica
  • Vol. 40, Issue 10, 1030002 (2020)
Ying Chen1、*, Can Zhang1, Chunyan Xiao2, Xueliang Zhao1、3, Yanxin Shi3, Hui Yang1, Zhengying Liu1, and Shaohua Li4
Author Affiliations
  • 1Hebei Province Key Laboratory of Test/Measurement Technology and Instrument, School of Electrical Engineering, Yanshan University, Qinhuangdao, Hebei 0 66004, China
  • 2Institute of Resources & Environment, Henan Polytechnic University, Jiaozuo, Henan 454000, China;
  • 3Center for Hydrogeology and Environmental Geology, China Geological Survey, Baoding, Hebei 0 71051, China
  • 4Hebei Sailhero Environmental Protection High-tech Co., Ltd., Shijiazhuang, Hebei 0 50035, China
  • show less
    DOI: 10.3788/AOS202040.1030002 Cite this Article Set citation alerts
    Ying Chen, Can Zhang, Chunyan Xiao, Xueliang Zhao, Yanxin Shi, Hui Yang, Zhengying Liu, Shaohua Li. Study on Prediction Model of Soil Cadmium Content Moisture Content Correction Based on GWO-SVR[J]. Acta Optica Sinica, 2020, 40(10): 1030002 Copy Citation Text show less
    XRF under different experimental conditions. (a) Under different cadmium contents; (b) under different moisture contents
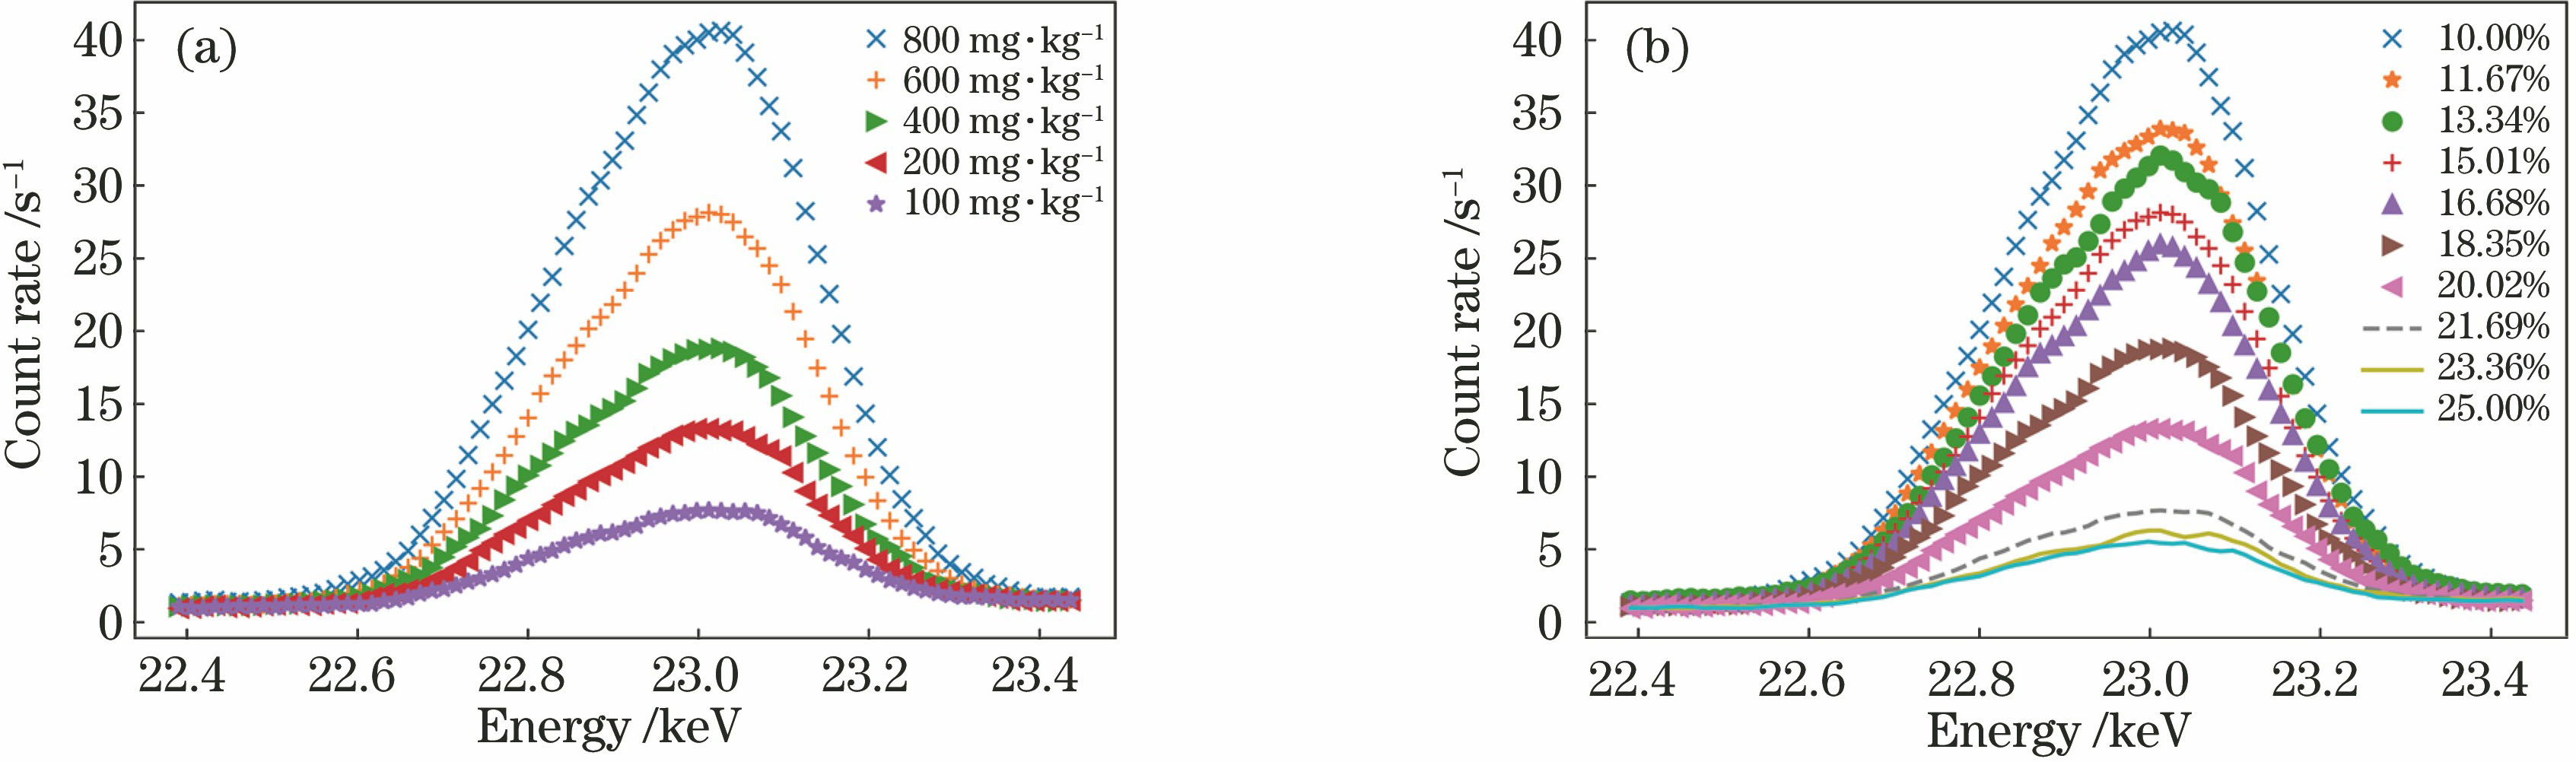
    Fig. 1. XRF under different experimental conditions. (a) Under different cadmium contents; (b) under different moisture contents
    Comparison of characteristic peaks before and after Gaussian function fitting
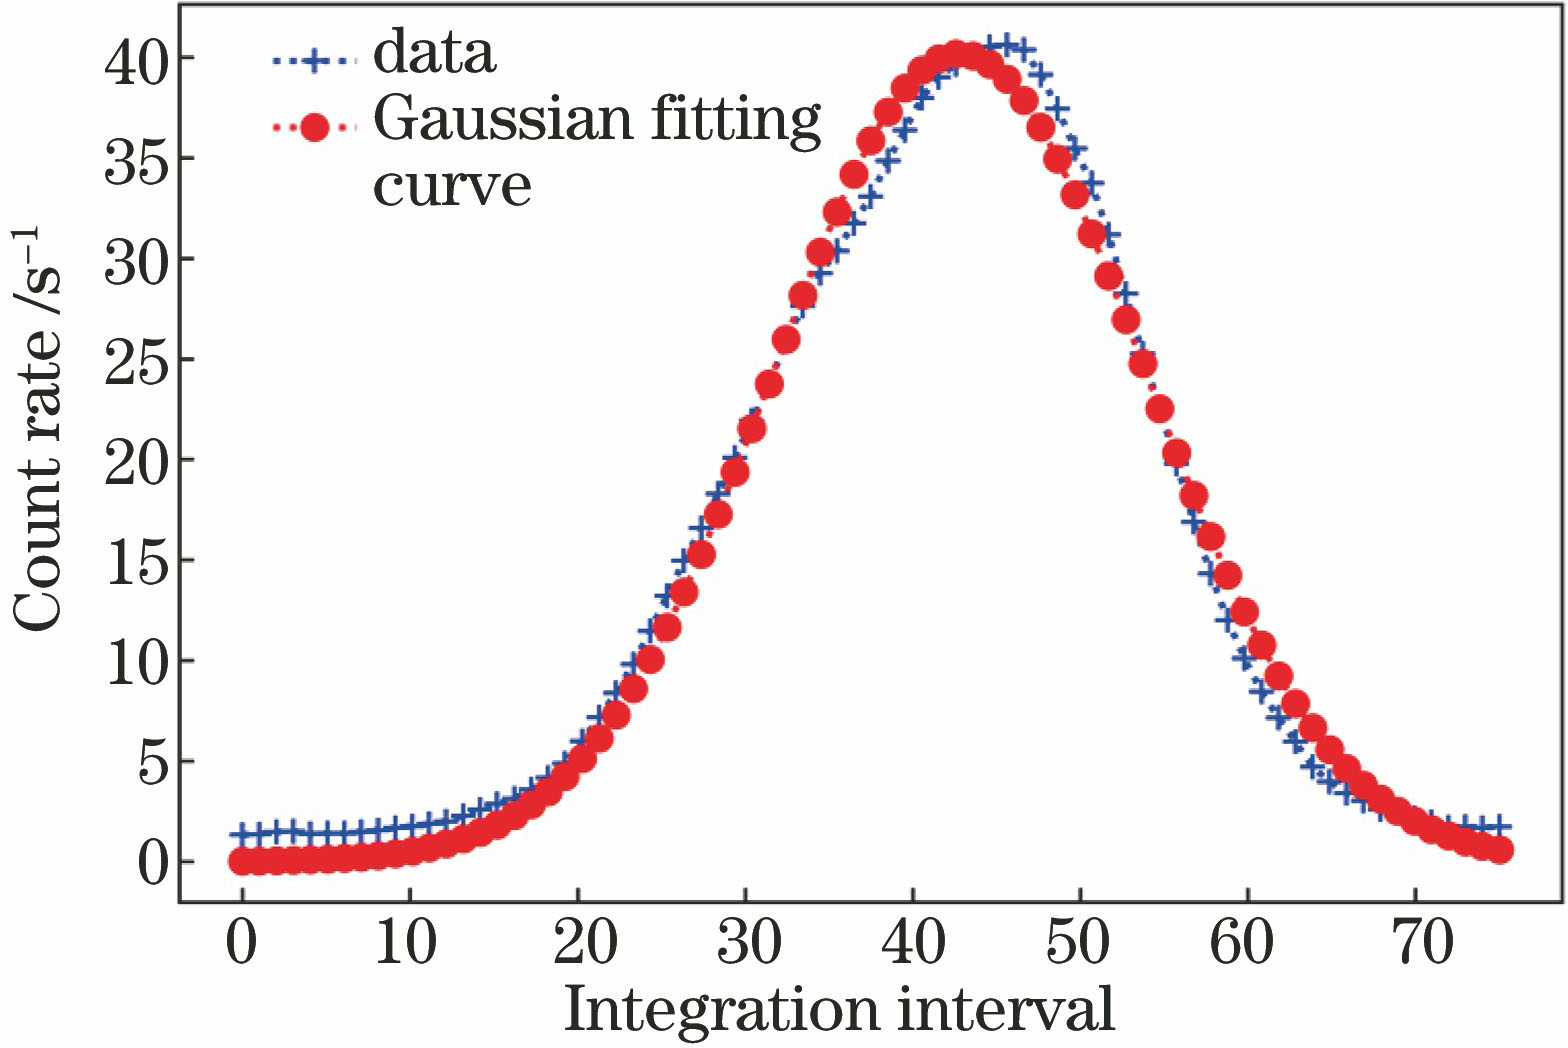
    Fig. 2. Comparison of characteristic peaks before and after Gaussian function fitting
    Flow chart of GWO-SVR algorithm
    Fig. 3. Flow chart of GWO-SVR algorithm
    Optimization process of sample box model and data comparison. (a) Iterative optimization process; (b) comparison between prediction data and test data
    Fig. 4. Optimization process of sample box model and data comparison. (a) Iterative optimization process; (b) comparison between prediction data and test data
    Optimization process of tablet model and data comparison. (a) Iterative optimization process; (b) comparison between prediction data and test data
    Fig. 5. Optimization process of tablet model and data comparison. (a) Iterative optimization process; (b) comparison between prediction data and test data
    Comparison between prediction data and real data. (a) Data of sample box model; (b) data of tablet model
    Fig. 6. Comparison between prediction data and real data. (a) Data of sample box model; (b) data of tablet model
    ModelR2MSEMAE
    ENR0.94250.05510.2157
    Lasso0.94240.05510.2158
    RR0.92330.08270.2642
    SVR0.96720.03540.1746
    GWO-SVR0.97530.01850.1502
    Table 1. Data comparison of sample box model
    ModelR2MSEMAE
    ENR0.90940.07060.2656
    Lasso0.90950.07110.2536
    RR0.87740.11370.3058
    SVR0.96110.03590.1640
    GWO-SVR0.98370.00930.0979
    Table 2. Data comparison of tablet model
    ModelR2MSEMNI
    PSO-SVR0.96530.037114
    GA-SVR0.95590.052217
    SA-SVR0.96840.03277
    GWO-SVR0.97530.01854
    Table 3. Data comparison of sample box SVR optimized model
    ModelR2MSEMNI
    PSO-SVR0.96750.02077
    GA-SVR0.96890.01959
    SA-SVR0.97590.01074
    GWO-SVR0.98370.00934
    Table 4. Data comparison of tablet SVR optimized model
    Ying Chen, Can Zhang, Chunyan Xiao, Xueliang Zhao, Yanxin Shi, Hui Yang, Zhengying Liu, Shaohua Li. Study on Prediction Model of Soil Cadmium Content Moisture Content Correction Based on GWO-SVR[J]. Acta Optica Sinica, 2020, 40(10): 1030002
    Download Citation