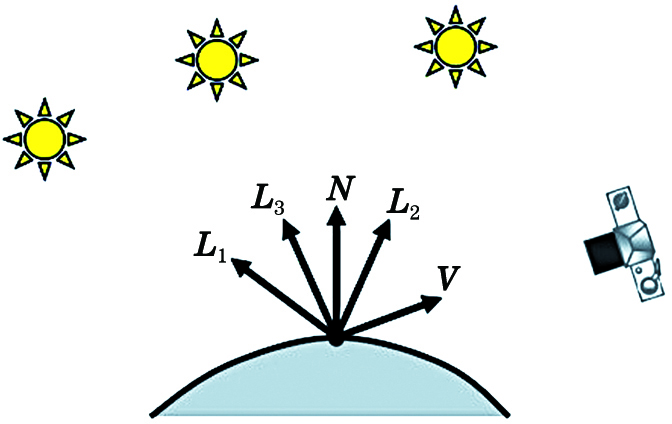
Fig. 1. Fix the incident light source and shoot
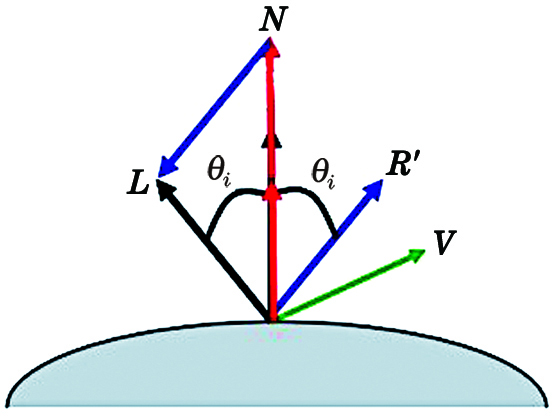
Fig. 2. Normal vector on the surface of an object
Fig. 3. Object surface normal vector coordinate system and surface depth Z
Fig. 4. Three-dimensional gray-scale map of signature handwriting
Fig. 5. A reference ruler that gives pseudo-color
Fig. 6. Partial signature stereogram of the sample under R, G, B channels
Fig. 7. Top view of stereo morphology of partial real signature handwriting
Fig. 8. Stereogram of partial signature of each group signer
Fig. 9. Sample diagram after corrosion expansion
Fig. 10. Effect of accurately locating feature areas
Fig. 11. Contour area of equal-cut signature handwriting
Fig. 12. Gray value of B channel area for group A1
Fig. 13. Gray value of R channel area for group A2
Fig. 14. Gray value of G channel area for group A3
Fig. 15. Gray scale of B channel area for group a1
Fig. 16. Gray scale of R channel area for group a2
Fig. 17. Gray scale of G channel area for group a3
Fig. 18. Full-amplitude gray scale difference distribution with groups C1 and c1
Fig. 19. Local gray scale difference distribution of group C1 after two equal parts
Fig. 20. Local gray scale difference distribution of group c1 after two equal parts
Fig. 21. Local gray scale difference distribution of group C1 after five equal parts
Fig. 22. Local gray scale difference distribution of group c1 after five equal parts
Fig. 23. Comparison of five and six equal parts of the sample picture of group C1
Fig. 24. Variation trend of gray level of channel B in the adjacent area of the stereo morphology diagram of B1 real signature
Fig. 25. Variation trend of gray level of channel B in the adjacent area of the stereo morphology diagram of b1 real signature
Group | V'1 | V'2 | V'3 | V'4 | Group | V'1 | V'2 | V'3 | V'4 |
---|
A1 | 1.054 | 0.8353 | 0.62 | 0.513 | a1 | 4.49 | 6.162 | 6.2 | 5.455 | A2 | 0.473 | 0.459 | 0.488 | 0.473 | a2 | 7.324 | 5.67 | 7.071 | 3.61 | A3 | 0.351 | 0.534 | 0.294 | 0.405 | a3 | 4.323 | 2.651 | 5.811 | 4.63 | B1 | 0.662 | 0.741 | 0.734 | 0.532 | b1 | 6.231 | 5.782 | 5.668 | 5.3 | B2 | 0.782 | 0.564 | 0.451 | 0.683 | b2 | 7.631 | 6.661 | 4.563 | 4.673 | B3 | 1.331 | 0.792 | 0.607 | 0.93 | b3 | 2.451 | 3.56 | 2.961 | 4.668 | C1 | 0.743 | 1.036 | 0.532 | 0.662 | c1 | 7.112 | 6.864 | 6.556 | 6.016 | C2 | 0.326 | 0.513 | 0.74 | 0.631 | c2 | 6.531 | 3.524 | 3.665 | 4.684 | C3 | 1.12 | 0.627 | 0.764 | 0.467 | c3 | 5.331 | 5.625 | 4.239 | 3.586 | D1 | 0.452 | 0.876 | 0.752 | 0.253 | d1 | 5.836 | 5.031 | 4.62 | 5.363 | D2 | 0.562 | 0.643 | 0.716 | 0.628 | d2 | 2.684 | 3.478 | 2.068 | 4.837 | E1 | 1.32 | 0.814 | 0.335 | 0.746 | e1 | 5.691 | 6.553 | 4.28 | 6.08 | E2 | 0.863 | 0.728 | 0.472 | 1.035 | e2 | 4.49 | 4.61 | 3.102 | 4.673 |
|
Table 1. Standard deviation of V'value of channel B in adjacent area of real sample and copied sample
Group | V'1 | V'2 | V'3 | V'4 | Group | V'1 | V'2 | V'3 | V'4 |
---|
A1 | 0.791 | 0.342 | 0.566 | 0.608 | a1 | 5.1 | 7.632 | 7.1 | 4.632 | A2 | 0.836 | 0.411 | 0.725 | 0.708 | a2 | 3.651 | 4.627 | 7.633 | 2.571 | A3 | 0.213 | 0.437 | 0.281 | 0.435 | a3 | 4.323 | 2.651 | 3.653 | 3.672 | B1 | 0.442 | 0.532 | 0.615 | 0.214 | b1 | 7.013 | 4.672 | 6.043 | 5.104 | B2 | 0.364 | 0.273 | 0.215 | 0.243 | b2 | 4.871 | 5.31 | 4.67 | 5.667 | Group | V'1 | V'2 | V'3 | V'4 | Group | V'1 | V'2 | V'3 | V'4 | B3 | 0.809 | 0.637 | 0.501 | 0.341 | b3 | 4.112 | 5.391 | 6.142 | 2.98 | C1 | 0.253 | 0.361 | 0.483 | 0.673 | c1 | 5.341 | 5.681 | 4.223 | 4.03 | C2 | 0.441 | 0.876 | 1.06 | 0.366 | c2 | 5.829 | 4.617 | 3.481 | 5.247 | C3 | 0.286 | 0.413 | 0.586 | 0.847 | c3 | 3.01 | 4.523 | 7.651 | 7.21 | D1 | 0.524 | 0.217 | 0.401 | 0.763 | d1 | 2.127 | 4.214 | 4.363 | 4.211 | D2 | 0.487 | 0.566 | 1.171 | 0.834 | d2 | 6.332 | 6.536 | 4.256 | 3.89 | E1 | 0.788 | 0.82 | 0.541 | 0.53 | e1 | 7.06 | 6.831 | 5.67 | 4.583 | E2 | 0.966 | 0.723 | 0.334 | 0.662 | e2 | 4.681 | 5.426 | 7.223 | 4.972 |
|
Table 2. Standard deviation of V'value of channel R in adjacent area of real sample and copied sample
Group | V'1 | V'2 | V'3 | V'4 | Group | V'1 | V'2 | V'3 | V'4 |
---|
A1 | 0.858 | 0.74 | 0.739 | 0.937 | a1 | 3.35 | 6.451 | 5.437 | 4.332 | A2 | 0.836 | 0.411 | 0.725 | 0.708 | a2 | 5.824 | 4.24 | 5.364 | 5.012 | A3 | 0.807 | 0.532 | 0.527 | 0.689 | a3 | 6.33 | 3.582 | 4.453 | 6.434 | B1 | 0.463 | 0.653 | 0.522 | 0.576 | b1 | 5.363 | 7.712 | 4.692 | 5.172 | B2 | 0.531 | 0.607 | 0.646 | 0.341 | b2 | 6.312 | 5.213 | 5.361 | 5.113 | B3 | 0.341 | 0.517 | 0.701 | 0.657 | b3 | 3.367 | 3.68 | 5.257 | 7.66 | C1 | 0.768 | 0.677 | 0.586 | 0.736 | c1 | 7.164 | 7.52 | 5.021 | 6.817 | C2 | 0.813 | 0.53 | 0.616 | 0.501 | c2 | 5.829 | 4.617 | 3.481 | 5.247 | C3 | 0.773 | 0.688 | 0.584 | 0.716 | c3 | 4.561 | 4.121 | 5.364 | 5.142 | D1 | 0.262 | 0.583 | 0.68 | 0.476 | d1 | 3.622 | 2.23 | 2.531 | 5.113 | D2 | 0.443 | 0.727 | 0.861 | 0.831 | d2 | 3.714 | 4.635 | 4.772 | 2.663 | E1 | 0.637 | 0.843 | 0.716 | 0.581 | e1 | 5.101 | 5.364 | 2.331 | 4.562 | E2 | 0.563 | 0.481 | 0.91 | 0.677 | e2 | 7.004 | 4.182 | 3.962 | 6.331 |
|
Table 3. Standard deviation of V'value of channel G in adjacent area of real sample and copy sample
Number of sample | Q=1 | Q=2 | Q=3 | Q=4 | Q=5 | Q=6 | Q=7 | Q=8 | Q=9 | Q=10 |
---|
1 | 96684 | 14390 | 4091 | 6743 | 46455 | 7009 | 17059 | 4141 | 7243 | 4782 | 2 | 10857 | 15604 | 4753 | 8324 | 51555 | 8618 | 20011 | 4802 | 8506 | 5842 | 3 | 82429 | 14944 | 3851 | 6665 | 39472 | 7108 | 18035 | 3738 | 6829 | 6497 | 4 | 86049 | 15266 | 4111 | 7219 | 39907 | 7141 | 20680 | 4202 | 7158 | 6529 | 5 | 89562 | 13232 | 3836 | 7138 | 41777 | 6763 | 15332 | 3975 | 6426 | 4376 | 6 | 88871 | 14405 | 4256 | 6576 | 40750 | 6945 | 16903 | 4217 | 6965 | 5495 | 7 | 87856 | 15024 | 4040 | 7215 | 41953 | 7883 | 19183 | 4068 | 7682 | 6496 | 8 | 86479 | 15418 | 3985 | 7104 | 41823 | 7363 | 21600 | 4032 | 7465 | 6409 | 9 | 91647 | 14753 | 4277 | 8269 | 43677 | 7959 | 20465 | 4171 | 8091 | 6306 | 10 | 92237 | 15346 | 4337 | 7798 | 45603 | 8082 | 20330 | 4467 | 8275 | 6751 |
|
Table 4. Partial feature vectors of the first sample of group A1
Group | Accuracy |
---|
Untreated feature | Treated feature |
---|
Aa1 | 53.333 | 78.333 | Aa2 | 46.666 | 83.333 | Aa3 | 48.333 | 95.000 | Bb1 | 76.666 | 85.000 | Bb2 | 65.000 | 88.333 | Bb3 | 68.333 | 91.666 | Cc1 | 35.000 | 88.333 | Cc2 | 51.666 | 88.333 | Cc3 | 41.666 | 78.333 | Dd1 | 48.333 | 81.666 | Dd2 | 56.666 | 86.666 | Ee1 | 31.666 | 93.333 | Ee2 | 43.333 | 85.000 |
|
Table 5. Comparison of accuracy rate of training and test for each classification model unit: %