• Advanced Photonics
  • Vol. 3, Issue 5, 056002 (2021)
Changqin Liu1、2、†, Shunjia Wang1, Sheng Zhang1, Qingnan Cai1, Peng Wang1, Chuanshan Tian1, Lei Zhou1、*, Yizheng Wu1、2、*, and Zhensheng Tao1、*
Author Affiliations
  • 1Fudan University, Department of Physics and State Key Laboratory of Surface Physics, Shanghai, China
  • 2Shanghai Research Center for Quantum Sciences, Shanghai, China
  • show less
    DOI: 10.1117/1.AP.3.5.056002 Cite this Article Set citation alerts
    Changqin Liu, Shunjia Wang, Sheng Zhang, Qingnan Cai, Peng Wang, Chuanshan Tian, Lei Zhou, Yizheng Wu, Zhensheng Tao. Active spintronic-metasurface terahertz emitters with tunable chirality[J]. Advanced Photonics, 2021, 3(5): 056002 Copy Citation Text show less
    Generation of chiral terahertz waves from a stripe-patterned spintronic-metasurface emitter. (a) Schematic of the experimental setup. The femtosecond pulse is focused to excite a stripe-patterned spintronic-metasurface emitter along the z direction. The stripe is aligned along the x direction. An orientated external magnetic field (H) is applied in the x–y plane with a field angle of θH. A few-cycle chiral terahertz pulse is generated, which can be decomposed into electric-field components parallel (E//) and perpendicularly (E⊥) to the stripes. The stripe width is d, and the spacing between the stripes is l. Under laser illumination, spin currents js are driven from the FM layer (yellow) to the NM layer (blue) through the interface. (b) Illustration of the current dynamics and inductive coupling in the x–y plane when θH=90 deg. Owing to ISHE, spin currents are converted to charge currents jc, which flow along the stripes. (c) Illustration of the charge and current dynamics and the capacitive coupling in the x–y plane when θH=0 deg⁡. jc flows perpendicularly to the stripes, which induces the transient charges (Qi) and counteractive currents (ji), which suppresses the current density ja⊥.
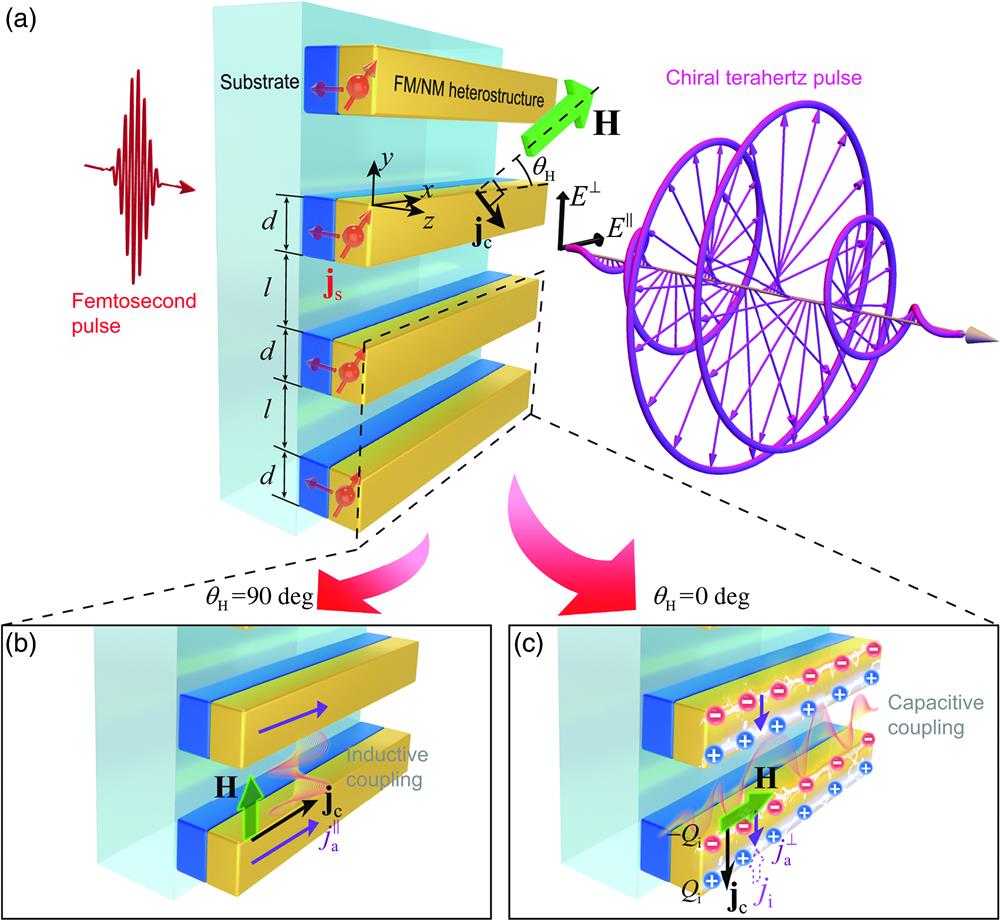
    Fig. 1. Generation of chiral terahertz waves from a stripe-patterned spintronic-metasurface emitter. (a) Schematic of the experimental setup. The femtosecond pulse is focused to excite a stripe-patterned spintronic-metasurface emitter along the z direction. The stripe is aligned along the x direction. An orientated external magnetic field (H) is applied in the xy plane with a field angle of θH. A few-cycle chiral terahertz pulse is generated, which can be decomposed into electric-field components parallel (E//) and perpendicularly (E) to the stripes. The stripe width is d, and the spacing between the stripes is l. Under laser illumination, spin currents js are driven from the FM layer (yellow) to the NM layer (blue) through the interface. (b) Illustration of the current dynamics and inductive coupling in the xy plane when θH=90  deg. Owing to ISHE, spin currents are converted to charge currents jc, which flow along the stripes. (c) Illustration of the charge and current dynamics and the capacitive coupling in the xy plane when θH=0deg. jc flows perpendicularly to the stripes, which induces the transient charges (Qi) and counteractive currents (ji), which suppresses the current density ja.
    Modulation of terahertz spectrum and phase due to metasurface structure. (a) Terahertz waveforms of E// under different field angles θH. The peak-to-peak field amplitude (Vpp) is defined as V1−V2. (b) Same as (a) for E⊥. (c) The peak-to-peak field amplitude (Vpp) of E// and E⊥ [defined in (a) and (b)] as a function of θH. (d) Normalized spectra of E// and E⊥ under different field angles θH. (e) The relative phase difference between the parallel and the perpendicular components φ⊥−φ// under different field angles θH. The colored regions represent the experimental errors.
    Fig. 2. Modulation of terahertz spectrum and phase due to metasurface structure. (a) Terahertz waveforms of E// under different field angles θH. The peak-to-peak field amplitude (Vpp) is defined as V1V2. (b) Same as (a) for E. (c) The peak-to-peak field amplitude (Vpp) of E// and E [defined in (a) and (b)] as a function of θH. (d) Normalized spectra of E// and E under different field angles θH. (e) The relative phase difference between the parallel and the perpendicular components φφ// under different field angles θH. The colored regions represent the experimental errors.
    Generation and manipulation of chiral terahertz waveforms. (a) Typical time dependence of the electric-field vector for a chiral terahertz waveform generated from a metasurface emitter with d=l=10 μm at θH=−17 deg. The simulation result under the same conditions is plotted for comparison. The terahertz wavevector k→THz is labeled. Inset: the illustration of the polarization states under different θH. L-EP: left-handed elliptical polarization; R-EP: right-handed elliptical polarization. (b) The parametric plots of E//(t) and E⊥(t) with different θH for d=l=10 μm under different θH. H-LP: horizontal linear polarization; V-LP: vertical linear polarization. The direction of k→THz is labeled. (c) The broadband ellipticity ⟨ε⟩ and the relative intensity η for the chiral terahertz waves generated with different stripe width d. (d) The spectrally resolved ellipticity ε(ω) as a function of d. The white filled symbols represent the anomaly frequencies shown in Fig. 4(e).
    Fig. 3. Generation and manipulation of chiral terahertz waveforms. (a) Typical time dependence of the electric-field vector for a chiral terahertz waveform generated from a metasurface emitter with d=l=10  μm at θH=17  deg. The simulation result under the same conditions is plotted for comparison. The terahertz wavevector kTHz is labeled. Inset: the illustration of the polarization states under different θH. L-EP: left-handed elliptical polarization; R-EP: right-handed elliptical polarization. (b) The parametric plots of E//(t) and E(t) with different θH for d=l=10  μm under different θH. H-LP: horizontal linear polarization; V-LP: vertical linear polarization. The direction of kTHz is labeled. (c) The broadband ellipticity ε and the relative intensity η for the chiral terahertz waves generated with different stripe width d. (d) The spectrally resolved ellipticity ε(ω) as a function of d. The white filled symbols represent the anomaly frequencies shown in Fig. 4(e).
    Spectral anomaly due to coupling over the metasurface structure. (a) The normalized field spectra of E⊥ for different d and l on a SiO2 substrate measured in experiments. The spectra are normalized by those obtained from homogeneous thin-film emitters (Ehomo). The solid triangles label the low-frequency anomaly features, and the open triangles label the high-frequency ones. (b) Same as (a) for E//. The solid diamonds label the corresponding low-frequency anomaly features. (c) and (d) Simulation results obtained under the same conditions as in (a) and (b). The dash-dot lines align the corresponding anomaly features shared by E// and E⊥ spectra. (e) The summary of the anomaly frequencies under different d and l as a function of the geometrical frequency fgeo=vc/(d+l). The black filled triangles and diamonds represent the low-frequency features of E⊥ and E//, respectively, for FF=0.5 [shown in (a) and (b)]. The black open triangles represent the high-frequency features of E⊥ for FF=0.5. The colored filled and open symbols are obtained from experiments with FF≠0.5, and the half-filled symbols illustrate anomaly frequencies measured from emitters with an Al2O3 substrate. The blue solid lines represent the linear fitting of the experimental data. (f) The spatial and frequency distribution of the normalized total current density flowing perpendicularly to the stripes ja⊥ (along the y axis) for d=l=50 μm. The flowing direction of the currents is labeled at the corner. (g) Same as (f) for ja// (along the x axis).
    Fig. 4. Spectral anomaly due to coupling over the metasurface structure. (a) The normalized field spectra of E for different d and l on a SiO2 substrate measured in experiments. The spectra are normalized by those obtained from homogeneous thin-film emitters (Ehomo). The solid triangles label the low-frequency anomaly features, and the open triangles label the high-frequency ones. (b) Same as (a) for E//. The solid diamonds label the corresponding low-frequency anomaly features. (c) and (d) Simulation results obtained under the same conditions as in (a) and (b). The dash-dot lines align the corresponding anomaly features shared by E// and E spectra. (e) The summary of the anomaly frequencies under different d and l as a function of the geometrical frequency fgeo=vc/(d+l). The black filled triangles and diamonds represent the low-frequency features of E and E//, respectively, for FF=0.5 [shown in (a) and (b)]. The black open triangles represent the high-frequency features of E for FF=0.5. The colored filled and open symbols are obtained from experiments with FF0.5, and the half-filled symbols illustrate anomaly frequencies measured from emitters with an Al2O3 substrate. The blue solid lines represent the linear fitting of the experimental data. (f) The spatial and frequency distribution of the normalized total current density flowing perpendicularly to the stripes ja (along the y axis) for d=l=50  μm. The flowing direction of the currents is labeled at the corner. (g) Same as (f) for ja// (along the x axis).
    Optimizing the terahertz ellipticity of the stripe-patterned metasurface emitter. (a) The broadband ellipticity ⟨ε⟩ for d=50 μm as a function of the FF. The solid line is the simulation results. The simulation results of the geometrical factor C as a function of FF are shown as the dashed line. (b) ⟨ε⟩ for FF=0.5 as a function of the stripe width d. The solid blue line is the simulation results. (c) 2D map of ⟨ε⟩ under different FFs and d. The open symbols label the experimental results in (a) and (b). The dashed line corresponds to d+l=100 μm, where the values of anomaly frequency and the terahertz central frequency coincide.
    Fig. 5. Optimizing the terahertz ellipticity of the stripe-patterned metasurface emitter. (a) The broadband ellipticity ε for d=50  μm as a function of the FF. The solid line is the simulation results. The simulation results of the geometrical factor C as a function of FF are shown as the dashed line. (b) ε for FF=0.5 as a function of the stripe width d. The solid blue line is the simulation results. (c) 2D map of ε under different FFs and d. The open symbols label the experimental results in (a) and (b). The dashed line corresponds to d+l=100  μm, where the values of anomaly frequency and the terahertz central frequency coincide.
    Changqin Liu, Shunjia Wang, Sheng Zhang, Qingnan Cai, Peng Wang, Chuanshan Tian, Lei Zhou, Yizheng Wu, Zhensheng Tao. Active spintronic-metasurface terahertz emitters with tunable chirality[J]. Advanced Photonics, 2021, 3(5): 056002
    Download Citation