• Journal of Geo-information Science
  • Vol. 22, Issue 6, 1216 (2020)
Wei SUN1、1、2、2、* and Xiaona LIN3、3
Author Affiliations
  • 1. 中国科学院地理科学与资源研究所 区域可持续发展分析与模拟重点实验室,北京 100101
  • 1Key Laboratory of Regional Sustainable Development Modeling, Institute of Geographic Sciences and Natural Resources Research, Chinese Academy of Sciences, Beijing 100101, China
  • 2. 中国科学院大学资源与环境学院,北京 100049
  • 2College of Resources and Environment, University of Chinese Academy of Sciences, Beijing 100049, China
  • 3. 深圳市城市规划设计研究院有限公司,深圳 518031
  • 3Urban Planning and Design Institute of Shenzhen, Shenzhen 518031, China
  • show less
    DOI: 10.12082/dqxxkx.2020.190282 Cite this Article
    Wei SUN, Xiaona LIN. The Spatial Distribution of Automobile Manufacturing Enterprises and its Influencing Factors in Liuzhou[J]. Journal of Geo-information Science, 2020, 22(6): 1216 Copy Citation Text show less
    Research area and sample distribution of automotive manufacturing enterprises in Liuzhou
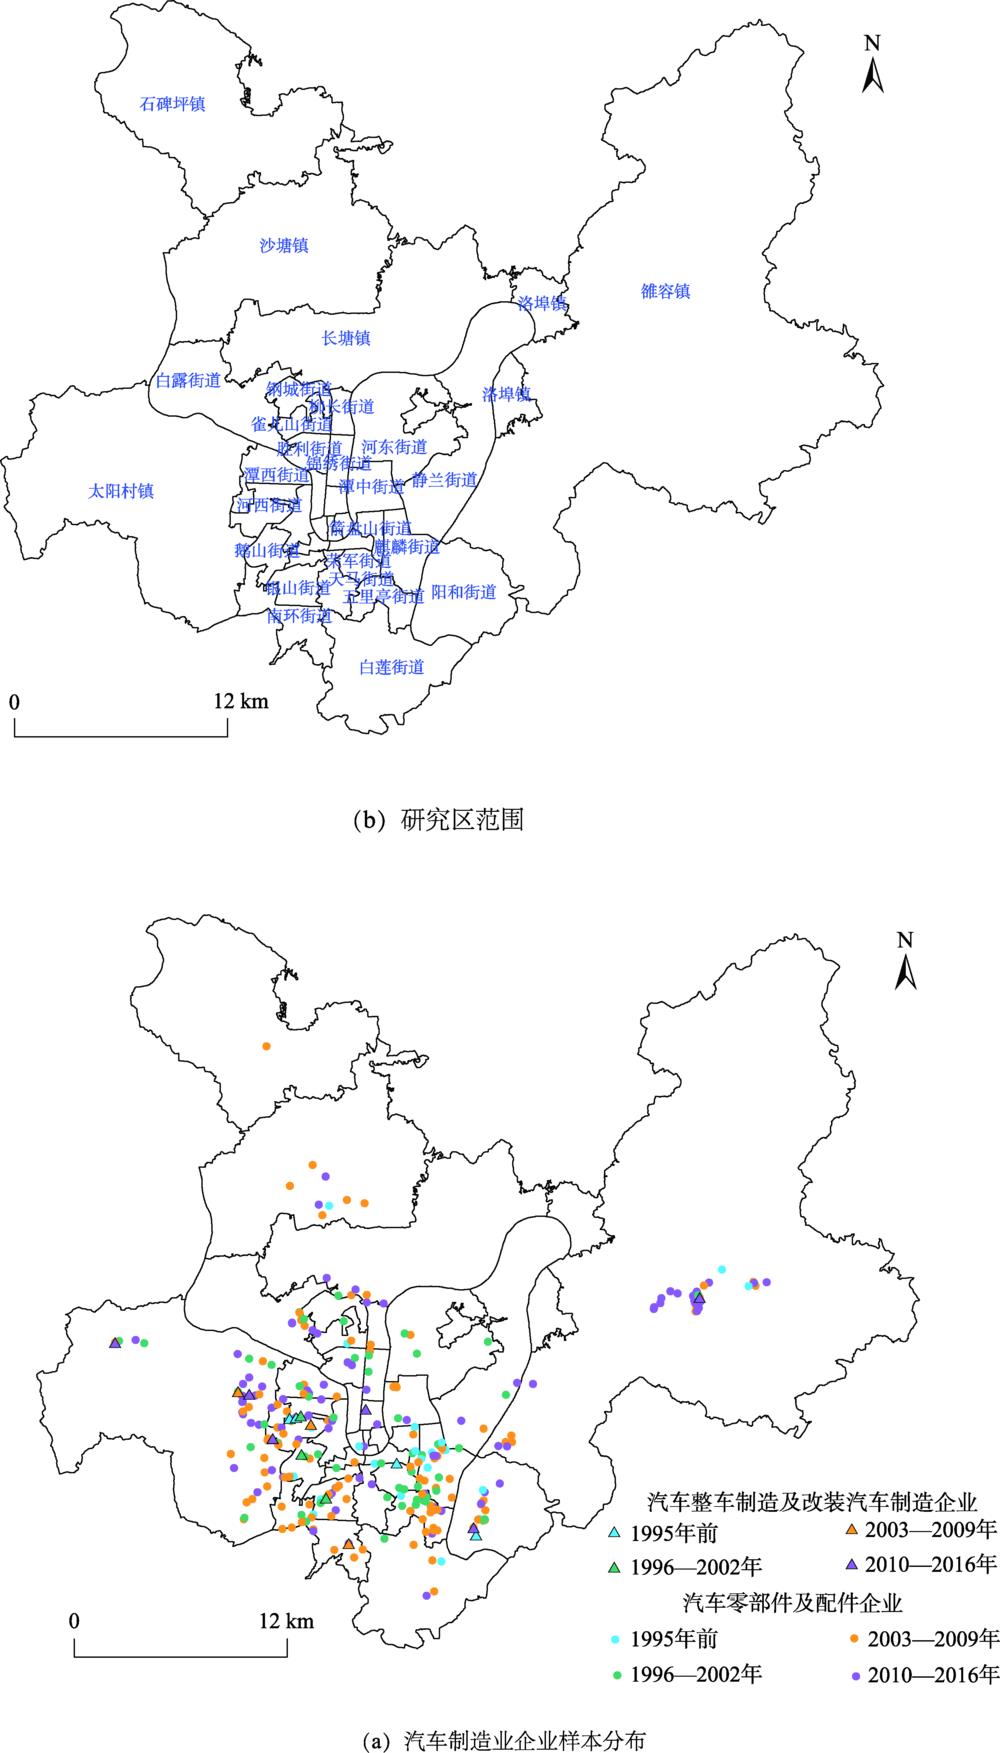
    Fig. 1. Research area and sample distribution of automotive manufacturing enterprises in Liuzhou
    Kernel density of the automotive manufacturing enterprises at different periods in Liuzhou City
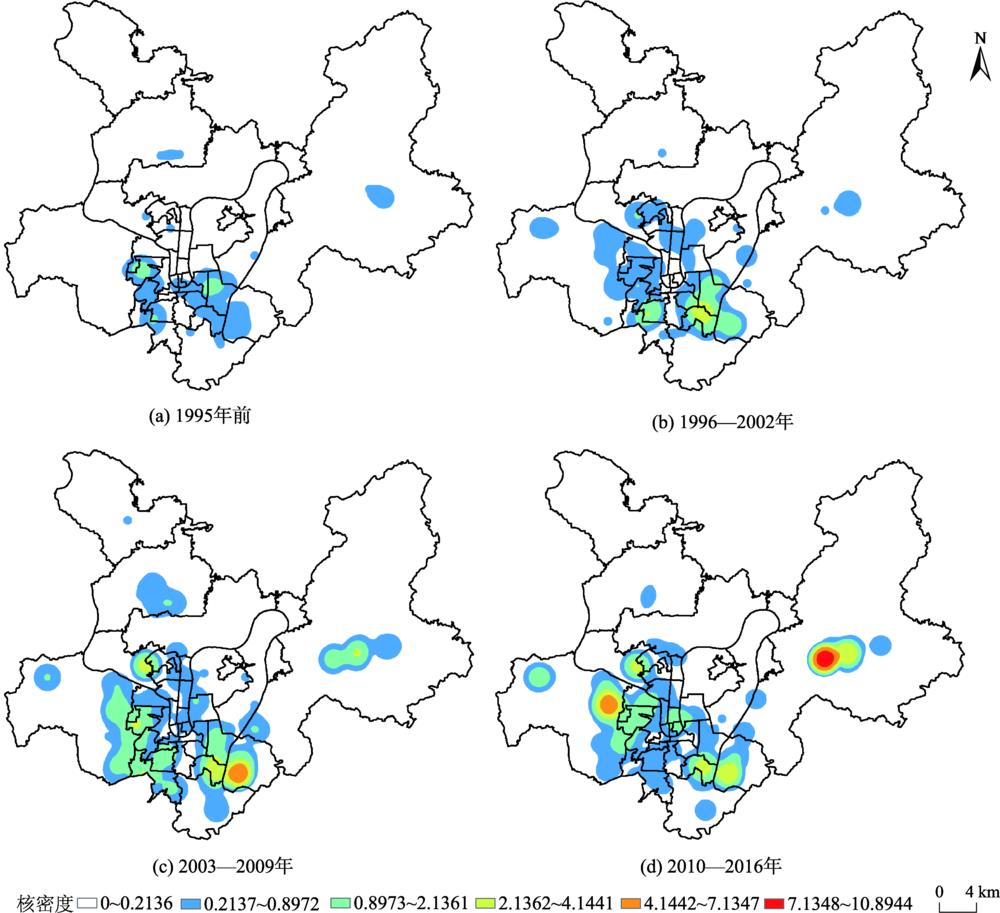
    Fig. 2. Kernel density of the automotive manufacturing enterprises at different periods in Liuzhou City
    Comparison among Ripley's L(d) function of automo-tive manufacturing enterprises at different periodsin Liuzhou City
    Fig. 3. Comparison among Ripley's L(d) function of automo-tive manufacturing enterprises at different periodsin Liuzhou City
    Ripley's L(d) function of automotive manufacturing enterprises at different periodsin Liuzhou City
    Fig. 4. Ripley's L(d) function of automotive manufacturing enterprises at different periodsin Liuzhou City
    Grid for influencing factors analysis of spatial distribution of automobile manufacturing enterprises
    Fig. 5. Grid for influencing factors analysis of spatial distribution of automobile manufacturing enterprises
    Accessibility of traffic network in Liuzhou
    Fig. 6. Accessibility of traffic network in Liuzhou
    The spatial distribution of the industrial parks in Liuzhou
    Fig. 7. The spatial distribution of the industrial parks in Liuzhou
    1995年前1996—2002年2003—2010年2010—2016年
    L(d)峰值2109.252744.573846.003396.72
    峰值距离/m5594.645114.505010.552733.31
    Table 1. Ripley's L(d) function extreme value and distance of automotive manufacturing enterprises at different periods
    因素变量指标
    传统空间因素土地价格x1格网内工业用地基准地价
    交通条件x2基于最短时间模型计算的格网交通可达性系数
    集聚经济地方化经济x32001年期末格网内汽车制造业企业数量
    城市化经济x42015年格网内对应乡镇街道的人口密度
    政策工业园区x5格网内是否有工业园区
    Table 2. Definition of independent variable
    级别基准地价/(元/m2
    I级790
    II级655
    III级518
    IV级373
    V级336
    VI级别300
    Table 3. Benchmark land price of Industrial land in Liuzhou in 2015
    YCoefRobust Std.Err.zp>|z|95% 置信区间
    土地价格x10.0060.0015.240.000[0.004,0.009]
    交通条件x2-1.1470.278-4.120.000[-1.692,-0.602]
    地方化经济x31.6280.2755.920.000[1.089,2.167]
    城市化经济x40.1160.0452.610.009[0.029,0.204]
    工业园区x51.5860.3864.110.000[0.830,2.343]
    _cons-5.1480.604-8.530.000[-6.331,-3.965]
    /lnalpha2.7140.206[2.311,3.117]
    alpha15.0923.103[10.087,22.581
    Table 4. Negative binomial modelresults of automotive manufacturing enterprises location choice in Liuzhou
    Wei SUN, Xiaona LIN. The Spatial Distribution of Automobile Manufacturing Enterprises and its Influencing Factors in Liuzhou[J]. Journal of Geo-information Science, 2020, 22(6): 1216
    Download Citation