
Fu Lei, Wang Siqi, Xin Jing, Zhang Zhenxi, Wang Jing. Research of Optical Breakdown Induced by Nanosecond Laser in Water and Gold Nanosphere Solutions[J]. Chinese Journal of Lasers, 2018, 45(2): 207029
- Chinese Journal of Lasers
- Vol. 45, Issue 2, 207029 (2018)
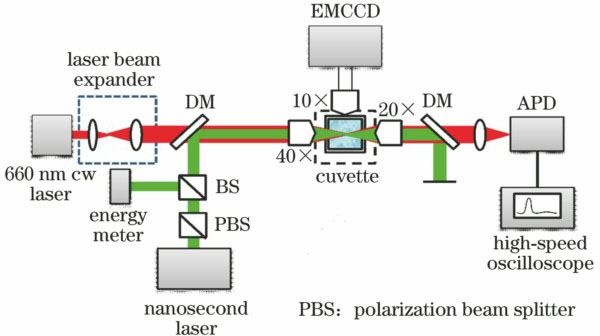
Fig. 1. Detection setup for optical breakdown induced by nanosecond laser
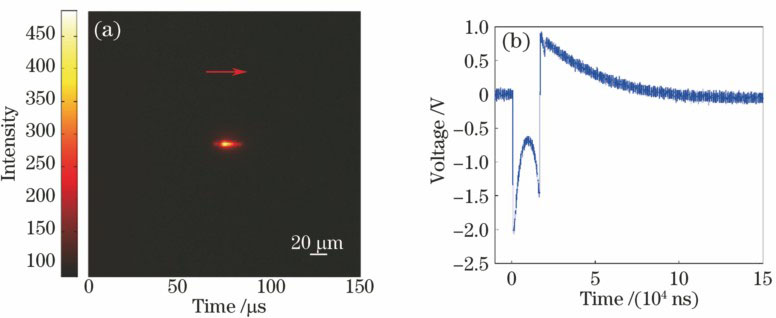
Fig. 2. Optical breakdown in deionized water, E=275 μJ. (a) Image of bright plasma, in which arrow represents the direction of laser propagation; (b) optical scattering time-resolved response of optical breakdown
Fig. 3. Bright plasma images generated by optical breakdown in deionized water induced by different power laser pulses (arrow represents direction of laser propagation, and scale bar represents the length of 20 μm. "back" represents the start of bright plasma, and "front" represents the end of bright plasma)
Fig. 4. Relationship of start position (back) and end position (front) of bright plasma with laser pulse energy. (a) Deionized water; (b) gold nanosphere solution, D=24 nm, dOD=0.1
Fig. 5. Comparison of optical breakdown betweendeionized water and gold nanosphere solution with different concentrations. (a) Relationship between probability of optical breakdown and energy of laser pulses; (b) probability of optical breakdown versus corrected energy of laser pulses; (c) energy correction coefficient of gold nanosphere solutions with different concentrations
Fig. 6. (a) Probability of optical breakdown with bright plasma induced in deionized water and gold nanosphere solutions with different concentrations as a function of the energy of laser pulses; (b) probability of optical breakdown with and without bright plasma induced in deionized water as a function of the energy of laser pulses
Fig. 7. Max radii of cavitation bubble generated by optical breakdown in deionized water and gold nanosphere solutions as a function of the energy of laser pulses
Fig. 8. (a) Probability of optical breakdown with bright plasma as a function of corrected energy of laser pulses; (b) max radii of cavitation bubble as a function of corrected energy

Set citation alerts for the article
Please enter your email address
© Copyright 2018-2021 | Chinese Laser Press. All Rights Reserved 沪ICP备15018463号-20