
Guang-Kai Liu, Hou-De Quan, Yan-Mei Kang, Hui-Xian Sun, Pei-Zhang Cui, Yue-Ming Han. A quadratic polynomial receiving scheme for sine signals enhanced by stochastic resonance [J]. Acta Physica Sinica, 2019, 68(21): 210501-1
- Acta Physica Sinica
- Vol. 68, Issue 21, 210501-1 (2019)
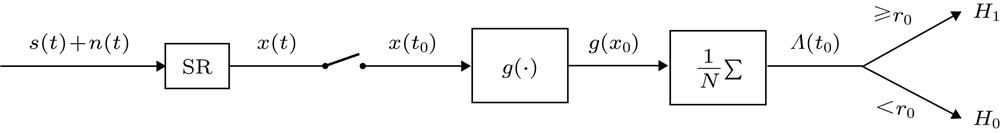
Fig. 1. Quadratic polynomial receiving structure for sine signals enhanced by SR.SR系统增强正弦信号的二次多项式接收结构
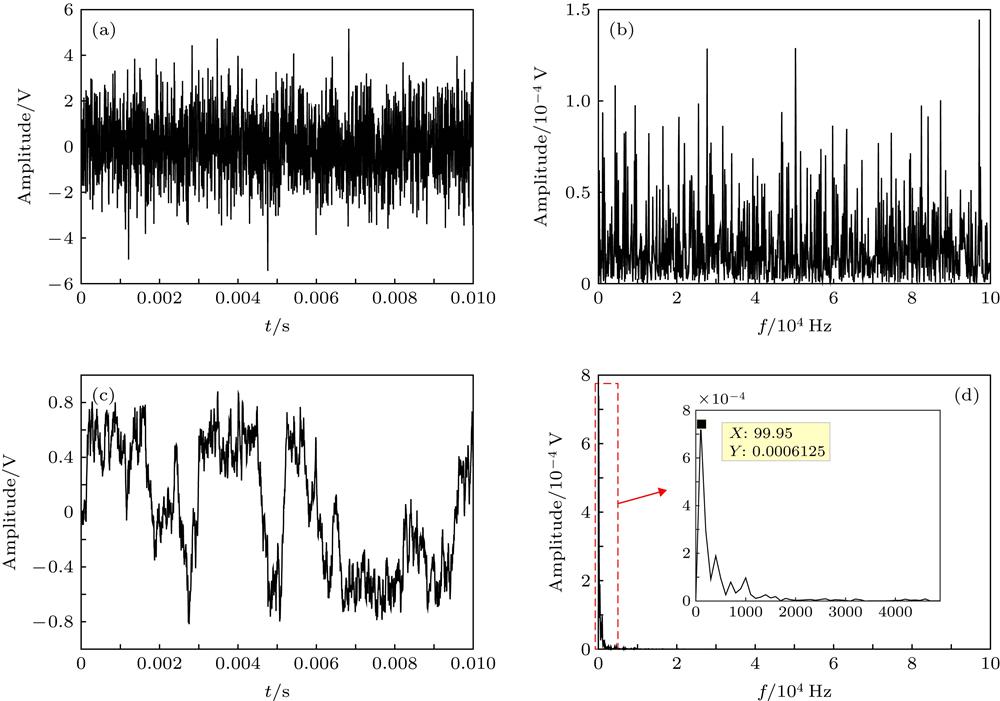
Fig. 2. Waveform of time and frequency zone of sine wave enhanced by SR (input SNR = –18 dB, the noise intensity
, signal amplitude
, parameters of system
,
): (a) The waveform of input signal in time zone; (b) the amplitude of input signal in frequency zone; (c) the waveform of output signal in time zone; (d) the amplitude of output signal in frequency zone
正弦信号经SR系统增强前后的时频域波形(输入SNR = –18 dB, 噪声功率
, 信号幅度
, SR系统参数
,
) (a) 输入信号时域波形; (b)输入信号频域幅值谱; (c)输出信号时域波形; (d)输出信号频域幅值谱
Fig. 3. Probability density function of particles of SR (input SNR = –14 dB, the noise intensity
, signal amplitude
, parameters of system
,
): (a) The probability density of particles before SR processed; (b) the probability density of particles after SR processed; (c) the partial of probability density of particles after SR processed
粒子处于不同位置时的概率密度(输入SNR = –14 dB dB, 噪声功率
, 信号幅度
, SR系统参数
,
) (a)未经SR处理的粒子的分布概率; (b)经SR处理后粒子的分布概率; (c)经SR处理后粒子的分布概率局部图
Fig. 4. Output of
at different N (input SNR = –18 dB, the noise intensity
, signal amplitude
, parameters of system
,
): (a) The waveform of test statistics when N = 1; (b) the waveform of test statistics when N = 10
不同N 时
的输出值(输入SNR = –18 dB, 噪声功率
, 信号幅度
, SR系统参数
,
) (a) N = 1时检验统计量的时域波形; (b) N = 10时检验统计量的时域波形
Fig. 5. Output probability density function of
at different N (input SNR = –14 dB, the noise intensity
, signal amplitude
, parameters of system
104,
,
): (a) The output probability density when N = 1; (b) the output probability density when N = 10; (c) the output probability density when N = 50; (d) the output probability density whenN = 100
不同N 时g (x 0)的输出概率密度(输入SNR = –14 dB, 噪声功率
, 信号幅度A = 0.4, SR系统参数
104,
,
) (a) N = 1时粒子的分布概率; (b) N = 10时粒子的分布概率; (c) N = 50时粒子的分布概率; (d) N = 100时粒子的分布概率
Fig. 6. Output bit error ratio of different receiving structure不同接收结构的系统输出误码率
Fig. 7. Output bit error ratio of quadratic polynomial receiving structure at different N 不同N 时的二次多项式接收结构的误码率

Set citation alerts for the article
Please enter your email address
© Copyright 2018-2021 | Chinese Laser Press. All Rights Reserved 沪ICP备15018463号-20