• Advanced Photonics
  • Vol. 4, Issue 4, 046001 (2022)
Wensheng Wang1、†, Chuankang Li1, Zhengyi Zhan1, Zhimin Zhang1, Yubing Han1, Cuifang Kuang1、2、3、4、*, and Xu Liu1、2
Author Affiliations
  • 1Zhejiang University, State Key Laboratory of Modern Optical Instrumentation, College of Optical Science and Engineering, Hangzhou, China
  • 2Shanxi University, Collaborative Innovation Center of Extreme Optics, Taiyuan, China
  • 3Research Center for Intelligent Chips and Devices, Zhejiang Lab, Hangzhou, China
  • 4Zhejiang University, Ningbo Research Institute, Ningbo, China
  • show less
    DOI: 10.1117/1.AP.4.4.046001 Cite this Article Set citation alerts
    Wensheng Wang, Chuankang Li, Zhengyi Zhan, Zhimin Zhang, Yubing Han, Cuifang Kuang, Xu Liu. Dual-modulation difference stimulated emission depletion microscopy to suppress the background signal[J]. Advanced Photonics, 2022, 4(4): 046001 Copy Citation Text show less
    Basic principle of dual-modulation difference stimulated emission depletion (dmdSTED) microscopy. (a)–(c) Time- and frequency-domain forms of the fluorescence signal and the corresponding spectrum under different modulation methods: no applied modulation, only the modulation frequency fm1 is applied to the excitation beam, modulation frequencies of fm1 and fm2 are simultaneously applied to the excitation and depletion beams. (d) Spatial and frequency domain characteristics of different fluorescent signal components. (e) Frequency characteristics of the finally detected fluorescence signal, where ξ(f1) contains the fluorescence in the center and outer ring areas, and ξ(f2) corresponds to the fluorescence in the outer ring area.
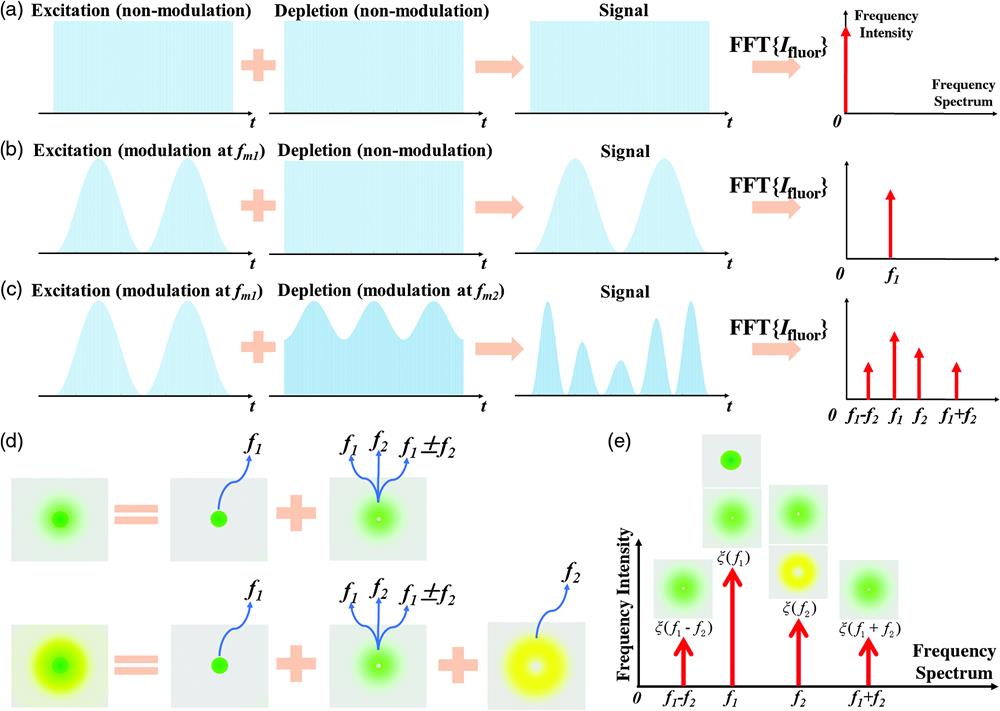
    Fig. 1. Basic principle of dual-modulation difference stimulated emission depletion (dmdSTED) microscopy. (a)–(c) Time- and frequency-domain forms of the fluorescence signal and the corresponding spectrum under different modulation methods: no applied modulation, only the modulation frequency fm1 is applied to the excitation beam, modulation frequencies of fm1 and fm2 are simultaneously applied to the excitation and depletion beams. (d) Spatial and frequency domain characteristics of different fluorescent signal components. (e) Frequency characteristics of the finally detected fluorescence signal, where ξ(f1) contains the fluorescence in the center and outer ring areas, and ξ(f2) corresponds to the fluorescence in the outer ring area.
    Imaging analysis of fluorescence signals at different frequencies and the influence of CM2. (a) Fluorescence signals corresponding to four frequency components. Scale bar: 400 nm. (b) Variation of ξ(f1) images and ξ(f2) images against CM2, with values of 0.15, 0.3, and 0.4. Scale bar: 500 nm. The analysis is characterized by 40-nm fluorescent nanoparticles.
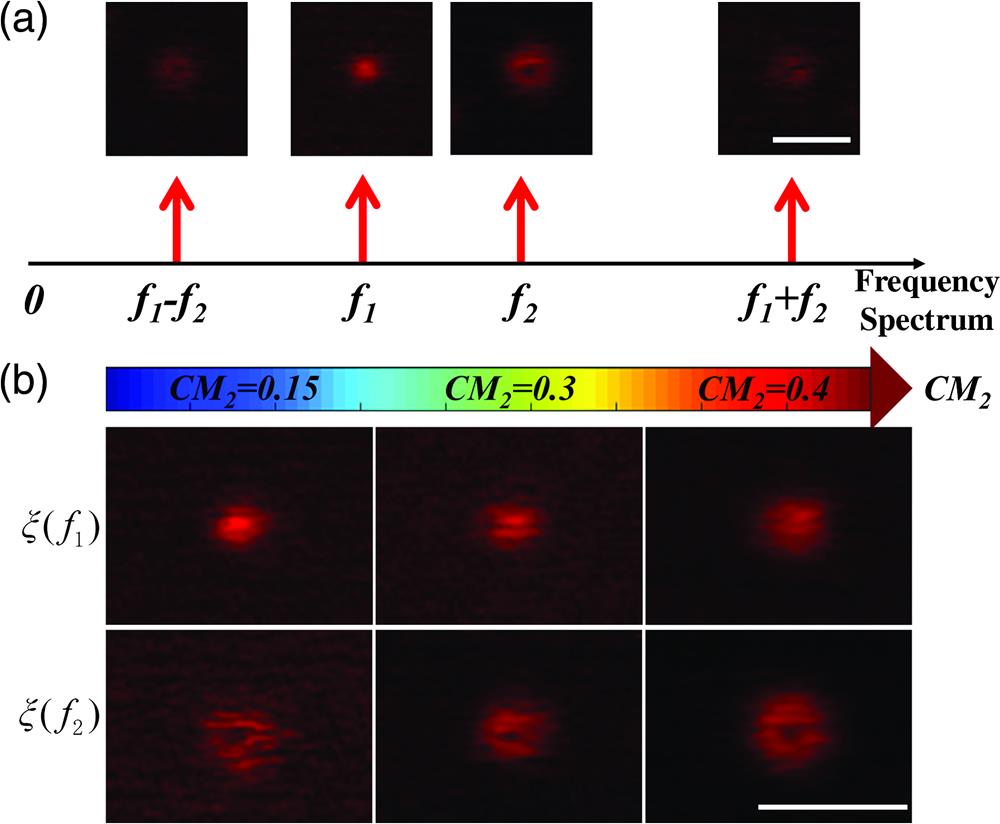
    Fig. 2. Imaging analysis of fluorescence signals at different frequencies and the influence of CM2. (a) Fluorescence signals corresponding to four frequency components. Scale bar: 400 nm. (b) Variation of ξ(f1) images and ξ(f2) images against CM2, with values of 0.15, 0.3, and 0.4. Scale bar: 500 nm. The analysis is characterized by 40-nm fluorescent nanoparticles.
    40-nm particle experimental results. (a)–(c) Imaging results of confocal, STED, and dmdSTED, respectively. Scale bar: 1.5 μm. (d)–(f) Partially enlarged view of the area marked by the blue dashed box in (a)–(c). Scale bar: 300 nm. (g) Image intensity change curve at the position along the blue dotted line in (d)–(f). The blue and red lines represent STED and dmdSTED, respectively, where the FWHM of dmdSTED is 63 nm. (h) Distribution of the statistical results of the FWHM of nanoparticles.
    Fig. 3. 40-nm particle experimental results. (a)–(c) Imaging results of confocal, STED, and dmdSTED, respectively. Scale bar: 1.5  μm. (d)–(f) Partially enlarged view of the area marked by the blue dashed box in (a)–(c). Scale bar: 300 nm. (g) Image intensity change curve at the position along the blue dotted line in (d)–(f). The blue and red lines represent STED and dmdSTED, respectively, where the FWHM of dmdSTED is 63 nm. (h) Distribution of the statistical results of the FWHM of nanoparticles.
    Biological cell imaging results. The imaging results of (a) confocal, (b) STED, and (c) dmdSTED. Scale bar: 2 μm. (d)–(f) Partially enlarged view of parts indicated by the blue dashed box in (a)–(c). Scale bar: 1 μm. (g) Image intensity variation curve along the blue dotted line. The blue, red, and yellow lines correspond to confocal, STED, and dmdSTED, respectively. The sample used here is vimentin labeled with Star Green.
    Fig. 4. Biological cell imaging results. The imaging results of (a) confocal, (b) STED, and (c) dmdSTED. Scale bar: 2  μm. (d)–(f) Partially enlarged view of parts indicated by the blue dashed box in (a)–(c). Scale bar: 1  μm. (g) Image intensity variation curve along the blue dotted line. The blue, red, and yellow lines correspond to confocal, STED, and dmdSTED, respectively. The sample used here is vimentin labeled with Star Green.
    Imaging of perovskite coating. Imaging results of (a) confocal, (b) STED, and (c) dmdSTED. (d) Anti-Stokes fluorescence through demodulating the frequency f2. (e) Signal intensity bars of confocal, STED, dmdSTED, and anti-Stokes fluorescence. (f) Intensity profiles along the blue dashed lines in (a)–(c). Scale bar: 2.5 μm.
    Fig. 5. Imaging of perovskite coating. Imaging results of (a) confocal, (b) STED, and (c) dmdSTED. (d) Anti-Stokes fluorescence through demodulating the frequency f2. (e) Signal intensity bars of confocal, STED, dmdSTED, and anti-Stokes fluorescence. (f) Intensity profiles along the blue dashed lines in (a)–(c). Scale bar: 2.5  μm.
    Wensheng Wang, Chuankang Li, Zhengyi Zhan, Zhimin Zhang, Yubing Han, Cuifang Kuang, Xu Liu. Dual-modulation difference stimulated emission depletion microscopy to suppress the background signal[J]. Advanced Photonics, 2022, 4(4): 046001
    Download Citation