• Acta Photonica Sinica
  • Vol. 50, Issue 11, 1131002 (2021)
Yixin CHEN1, Xiuhua FU1、*, Gong ZHANG1, Jing ZHANG1, and Fei YANG2
Author Affiliations
  • 1College of Photoelectric Engineering,Changchun University of Science and Technology,Changchun 130022,China
  • 2Changchun Institute of Optics,Fine Mechanics and Physics,Chinese Academy of Sciences,Changchun 130033,China
  • show less
    DOI: 10.3788/gzxb20215011.1131002 Cite this Article
    Yixin CHEN, Xiuhua FU, Gong ZHANG, Jing ZHANG, Fei YANG. Design Method of Notch Filter Based on One-dimensional Photonic Crystal Band Structure[J]. Acta Photonica Sinica, 2021, 50(11): 1131002 Copy Citation Text show less
    (A B)^N periodic structure of 1-D photonic crystal
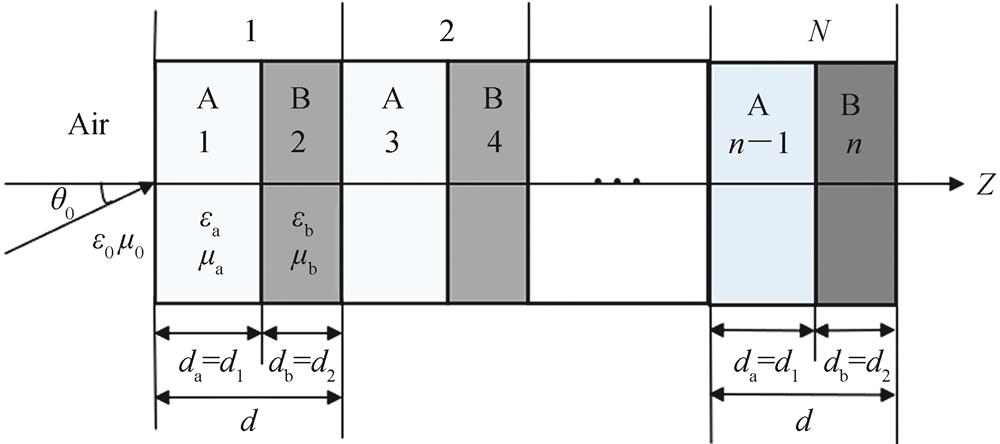
    Fig. 1. (A B)^N periodic structure of 1-D photonic crystal
    Dispersion curve of(A B)^N,(A B A)^N and(A B B A)^N
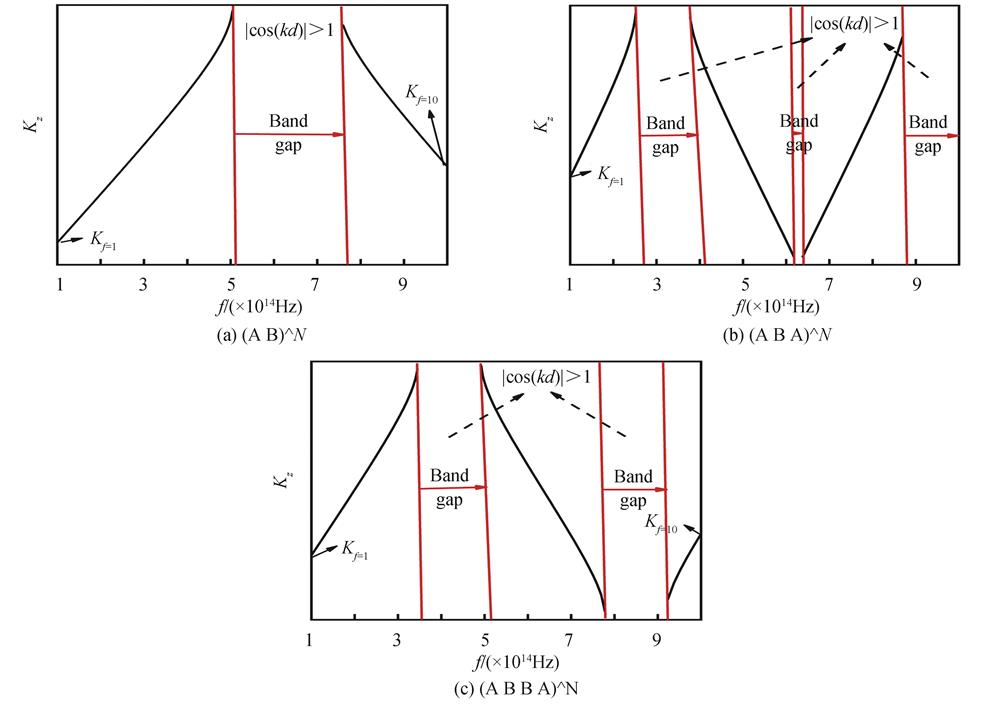
    Fig. 2. Dispersion curve of(A B)^N,(A B A)^N and(A B B A)^N
    Dispersion curve corresponding to thickness d1,d2 and 0.5 d1,d2
    Fig. 3. Dispersion curve corresponding to thickness d1d2 and 0.5 d1d2
    Dispersion curve of na=1.38 and nB/nA=1.7
    Fig. 4. Dispersion curve of na=1.38 and nB/nA=1.7
    Band gap of nA=1.38 and nB/nA=1.7
    Fig. 5. Band gap of nA=1.38 and nB/nA=1.7
    The width of the first band gap when nA or nB/nA is a fixed value is the fixed value
    Fig. 6. The width of the first band gap when nA or nB/nA is a fixed value is the fixed value
    When nA is a fixed value,the forbidden band width of the second forbidden band,the third forbidden band and the fourth forbidden band
    Fig. 7. When nA is a fixed value,the forbidden band width of the second forbidden band,the third forbidden band and the fourth forbidden band
    Forbidden band width with constant refractive index ratio
    Fig. 8. Forbidden band width with constant refractive index ratio
    Dispersion curve when coefficient,center wavelength,incident angle and refractive index ratio are the same
    Fig. 9. Dispersion curve when coefficient,center wavelength,incident angle and refractive index ratio are the same
    Dispersion curve and band gap width corresponding to center wavelength 300~1 100 nm
    Fig. 10. Dispersion curve and band gap width corresponding to center wavelength 300~1 100 nm
    The width of the band gap of the center wavelength under different refractive index ratios
    Fig. 11. The width of the band gap of the center wavelength under different refractive index ratios
    The position where each band gap of the center wavelength ends under different refractive index ratios
    Fig. 12. The position where each band gap of the center wavelength ends under different refractive index ratios
    The dispersion curve and band gap width corresponding to different incident angles
    Fig. 13. The dispersion curve and band gap width corresponding to different incident angles
    Dispersion curve and spectrum comparison of blue and green notch filters
    Fig. 14. Dispersion curve and spectrum comparison of blue and green notch filters
    Dispersion curve and spectrum comparison of blue and green notch filters
    Fig. 15. Dispersion curve and spectrum comparison of blue and green notch filters
    MaterialLnMaterialHn
    Na3AlF61.3/1.38TiO21.9/2.3
    MgF21.38H42.1
    SiO21.46Ta2O52.16
    Al2O31.54/1.62Ti3O52.35
    YbF31.52/1.48ZnS2.35/2.16
    SiO1.55Ge4.4
    Table 1. Refractive index of common materials7
    nAp3p4nB/nAp3p4
    1.22195.7-174.71.581.7912.36
    1.3208.9-187.8217013.6
    1.38221.9-201.82.525019
    1.46223.2-214.83332.913.01
    1.54247.8-2263.5409.610.14
    1.62260.5-237.84482.99.01
    Table 2. The value of the fitting coefficient when nA or nB/nA is a fixed value
    nAnB/nA<1.7nB/nA>1.7
    p5p6p5p6
    1.22-23.5740.1463.02-110
    1.3-23.5740.1466.79-117.3
    1.38-27.8647.7170.51-124.1
    1.46-27.8647.7174.43-131.9
    1.54-30.7152.4378.78-140.8
    1.62-33.5757.1481.63-145
    Table 3. Fitting coefficient value of the second band gap
    nAa1a2a3b1b2b3c1c2c3
    1.2219.14183.8186.60.3694.784.7131.2460.197 4-9.074
    1.320.24135137.20.462 14.844.7440.927 4-0.021 58-9.227
    1.3822.14100.6103.50.497 44.8874.7570.859 1-0.272 9-9.401
    1.4622.81130.7132.40.589 74.921132.40.532-0.337 4-9.521
    1.5424.17127.3129.20.691 64.8194.7070.212 3-0.036 79-9.205
    1.6235.62144.8080.009 0352.9787.9580.540 97.478-3.945
    Table 4. Fitting coefficient value of the third band gap
    nAa1a2a3b1b2b3c1c2c3
    1.2230.8722.713.8240.886 61.4272.764-0.416 81.9427.032
    1.3377.63642.8250.8070.8883.2150.850 13.8276.142
    1.38396.7388.11.7150.826 70.889 93.5490.77023.7964.953
    1.4641.7634.822.9850.846 61.3543.25-0.0162.355.766
    1.5427.449.2383.7960.5962.5323.408-0.549-0.4975.888
    1.6235.4311.17.7830.588 33.9754.598-0.787 5-3.8093.906
    Table 5. Fitting coefficient value of the fourth band gap
    nAnB/nA
    1.223.26
    1.33.288
    1.383.316
    1.463.344
    1.543.72
    1.623.4
    Table 6. The corresponding nA and nB/nA when the third forbidden band disappears
    nB/nASecond band gapThird band gapFourth band gap
    p7p8p7p8p7p8
    1.50712.5-3.250.13
    20.415239.3-280.50.28
    2.522.518.5525-11.512.52.75
    352.514.9512.5-6.2522.5-3.45
    3.577.517.45-12.523.2525-6.5
    41002002725-12.5
    Table 7. Fitting coefficient values of the second,third,and fourth band gaps
    nB/nAFirst band gapSecond band gapThird band gapFourth band gap
    p1p2p1p2p1p2p1p2
    1.40.262 51.650.018 5-0.350.026 5-0.150.0071.1
    1.50.304 59.250.022 50.450.031-0.30.011 5-0.45
    20.519 50.150.047 5-1.650.045-0.50.022 5-0.95
    2.50.6810.50.062-0.60.054-0.20.029-0.7
    30.819 5-0.450.071 50.550.0600.0310.9
    3.50.940 50.250.0800.064 50.450.036 51.45
    41.052-0.20.087 5-0.450.0690.30.040
    Table 8. Fitting coefficient values of the four band gaps
    nB/nAFirst band gapSecond band gapThird band gapFourth band gap
    p1p2p1p2p1p2p1p2
    1.40.8500.3180.350.02550.850.1960.225
    1.50.8420.6
    20.8010.35
    2.50.780
    30.7730.9
    3.50.7650.35
    40.751 50.35
    Table 9. Fitting coefficient values of the four band gaps
    Coefficienp9p10p11
    First band gap0.015 19-0.100 5186.1
    Second band gap0.007 725-0.050 790.047 62
    Third band gap0.002 828-0.006 06120.01
    Fourth band gap0.000 529 10.066 67-0.119
    Table 10. Fitting coefficient values of the four band gaps
    RGB notch filterDesign requirements/nmDispersion curve/nmTransmittance spectrum/nm
    Bule notch filter385~505385~505386~504
    Green notch filter525~575525~575526~575
    Red notch filter600~700600~654/650~700601~653/651~700
    Table 11. The forbidden band(cut-off zone)required by the design of RGB notch filter and the corresponding actual results
    Yixin CHEN, Xiuhua FU, Gong ZHANG, Jing ZHANG, Fei YANG. Design Method of Notch Filter Based on One-dimensional Photonic Crystal Band Structure[J]. Acta Photonica Sinica, 2021, 50(11): 1131002
    Download Citation