
Yang Cao, Hao Wen, Yuchao Dang. LSTM-SCFlips Decoding Method in Free-Space Optical Communication[J]. Acta Optica Sinica, 2021, 41(14): 1406004
- Acta Optica Sinica
- Vol. 41, Issue 14, 1406004 (2021)
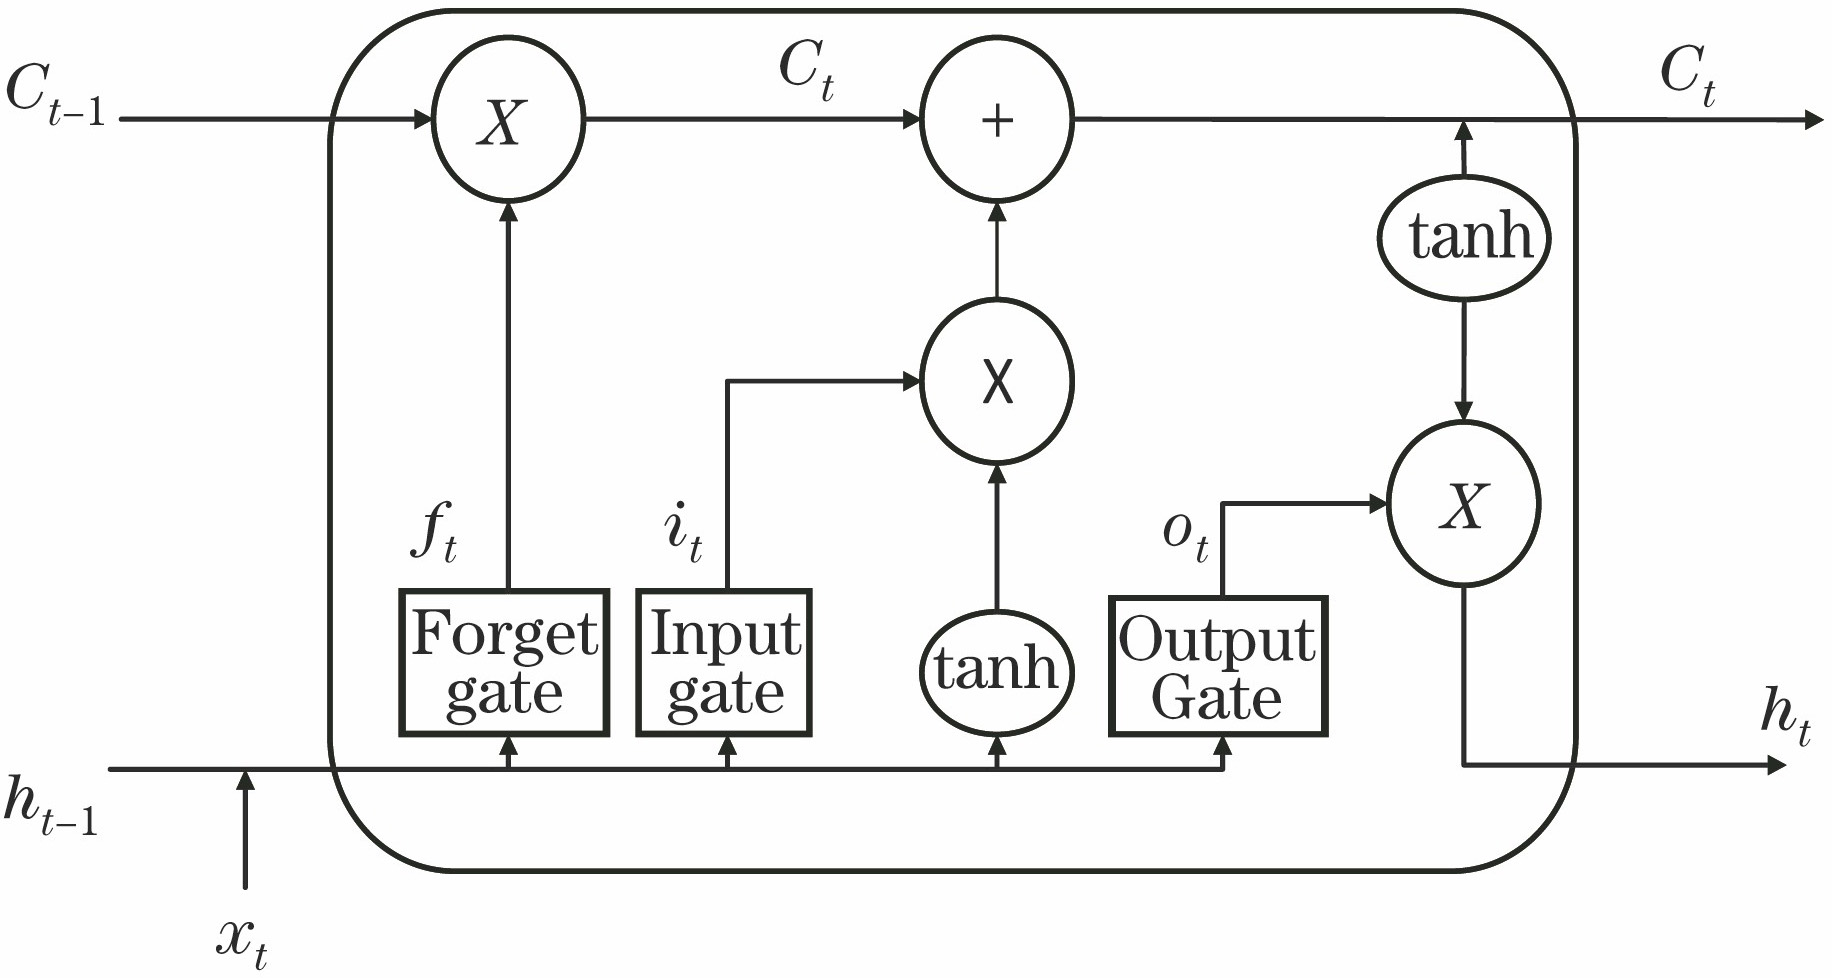
Fig. 1. LSTM neural network model assisted FSO system model for polarization code decoding
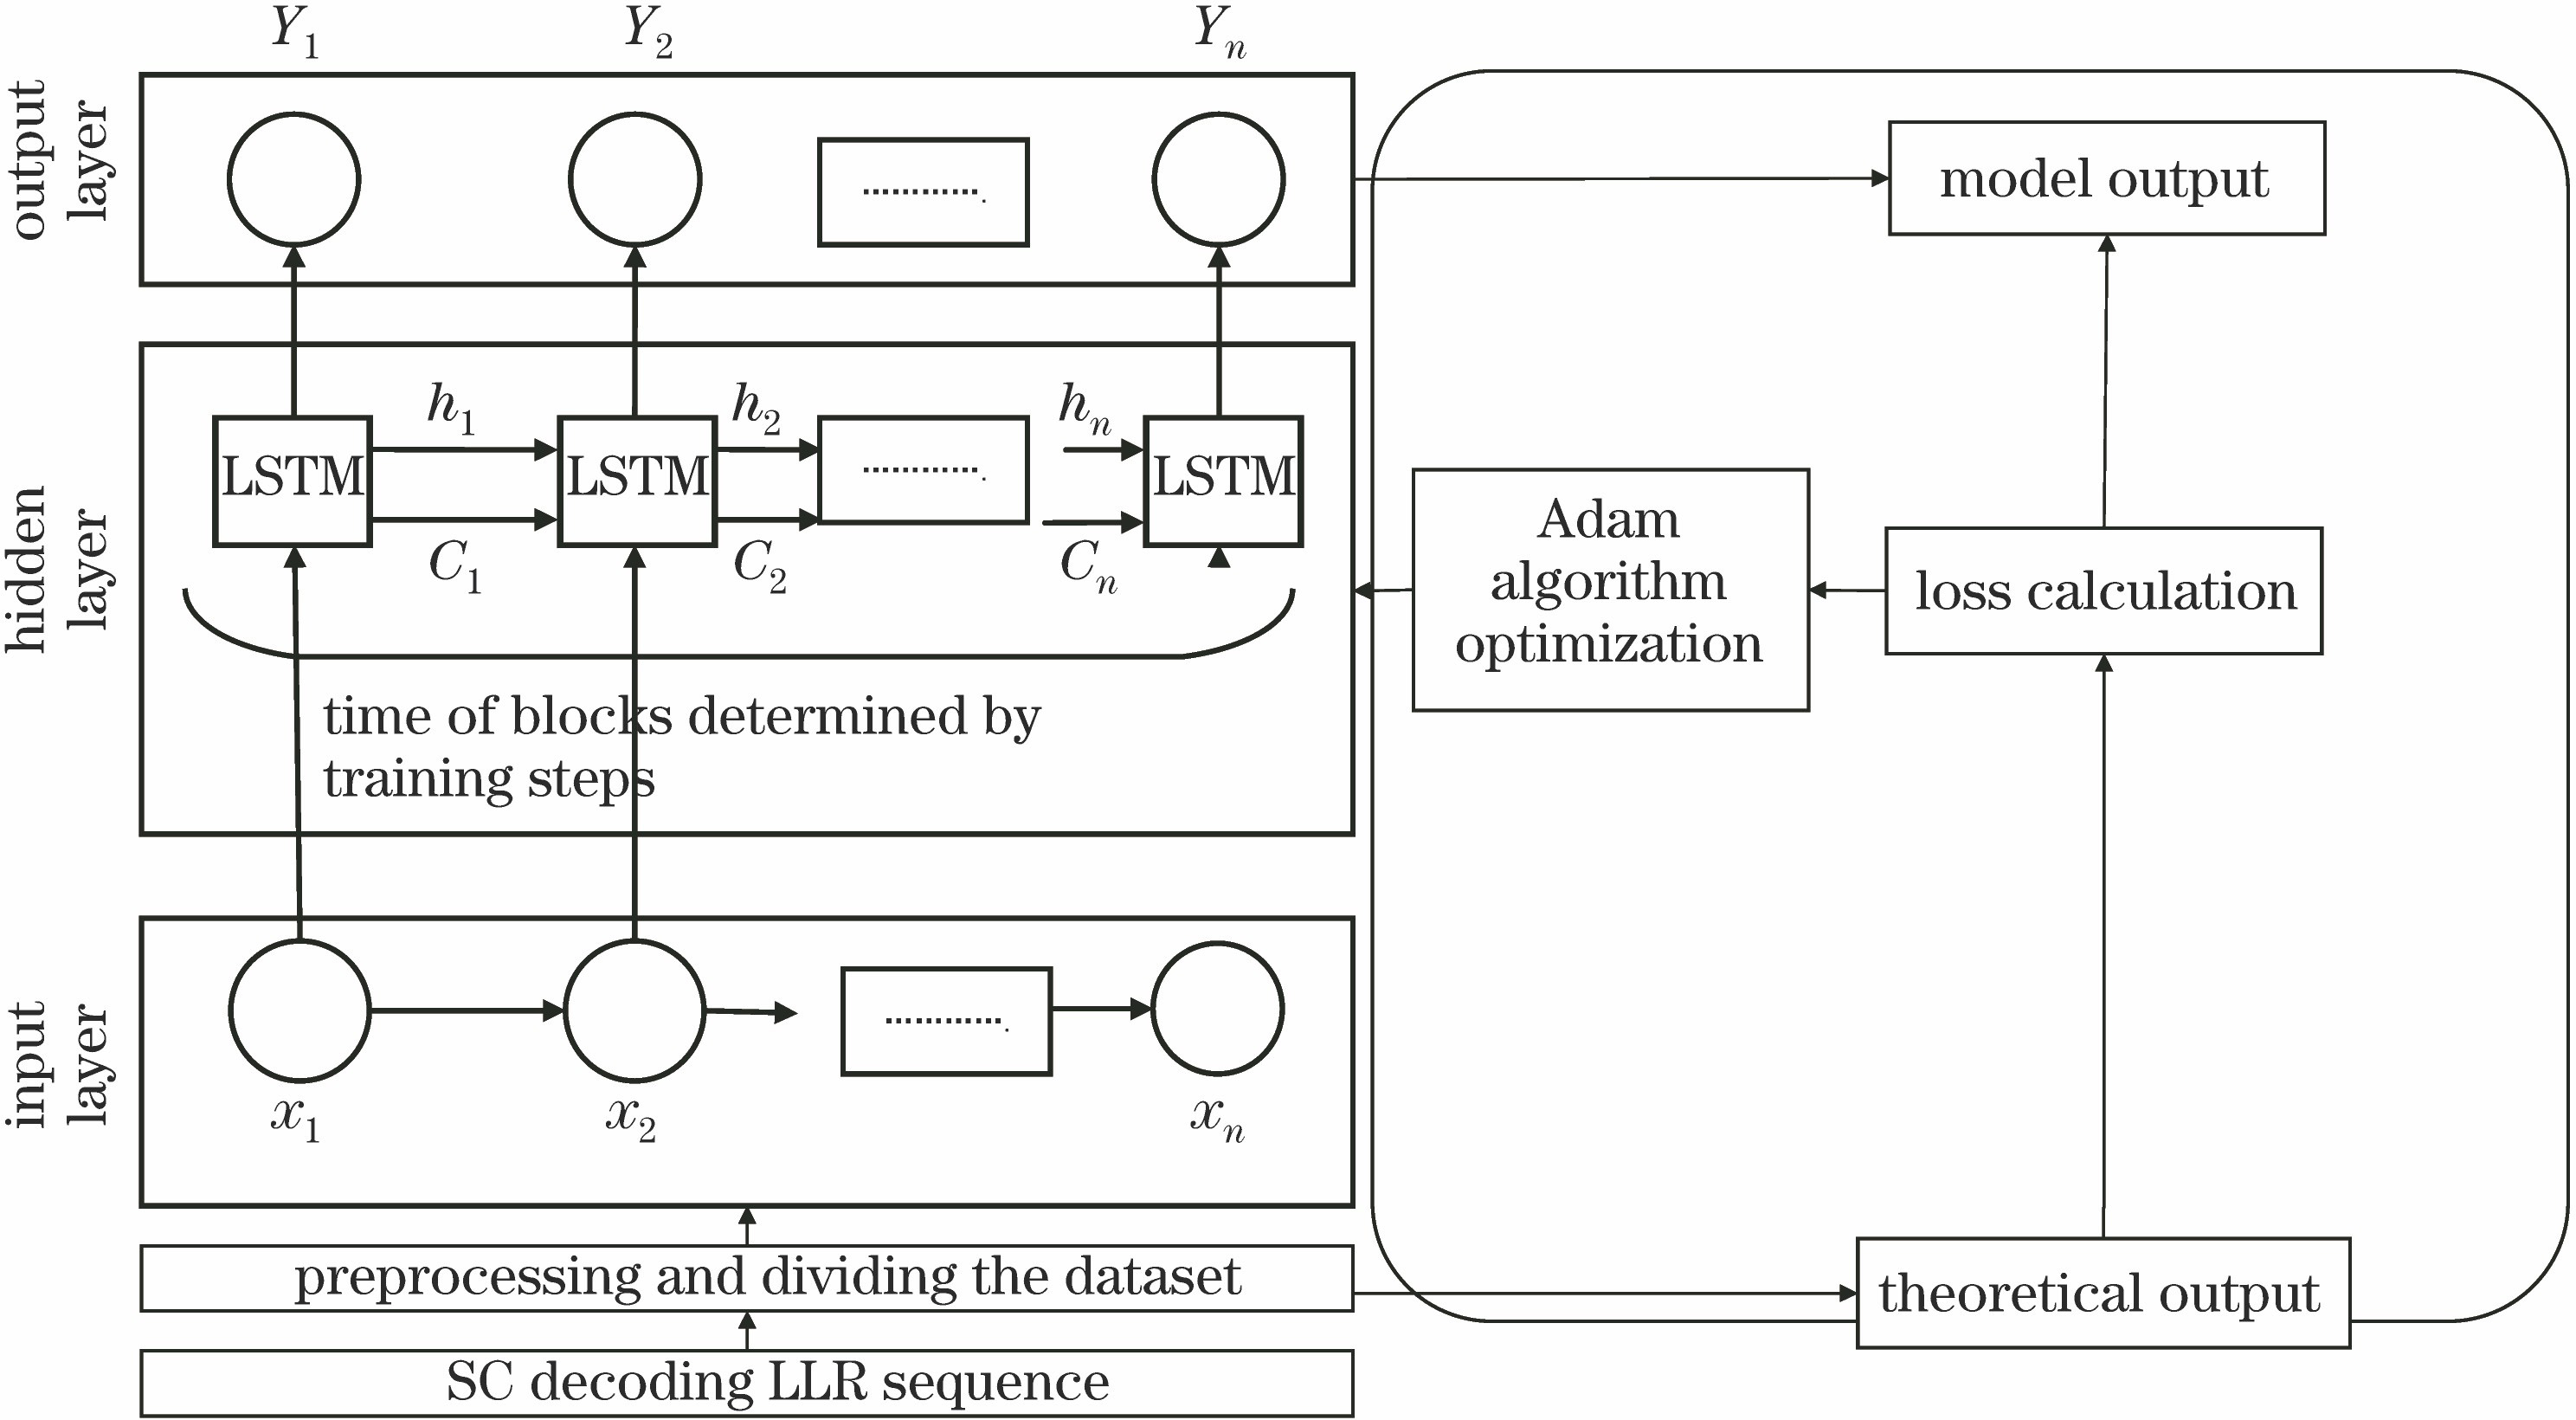
Fig. 2. Basic unit of the LSTM network
Fig. 3. LSTM network prediction model framework
Fig. 4. Execution flow chart of LSTM-SCFlips decoding method
Fig. 5. Root mean square error distribution in a weak turbulence channel
Fig. 6. Training time in weak turbulence channel
Fig. 7. Performance of LSTM network in weak turbulence channel
Fig. 8. Correct recognition rate of optimal flip position in weak turbulence channel (σ0=0.2)
Fig. 9. Performance comparison chart of different bit flipping decoding schemes under weak turbulence channel (σ0=0.2)
Fig. 10. Comparison of decoding performance under different turbulence intensities
|
Table 1. Simulation parameters
|
Table 2. Comparison of RMSE of different models under weak turbulence channel (σ0=0.2)
|
Table 3. Average decoding time of each frame in different polarization code bit flipping decoding methodsunit: s

Set citation alerts for the article
Please enter your email address
© Copyright 2018-2021 | Chinese Laser Press. All Rights Reserved 沪ICP备15018463号-20