
Dingyi Dan, Keqin Ding, Anqing Shu. Optimization and Test of Fiber Bragg Grating Strain Sensor with Loop Structure[J]. Laser & Optoelectronics Progress, 2022, 59(17): 1728002
- Laser & Optoelectronics Progress
- Vol. 59, Issue 17, 1728002 (2022)
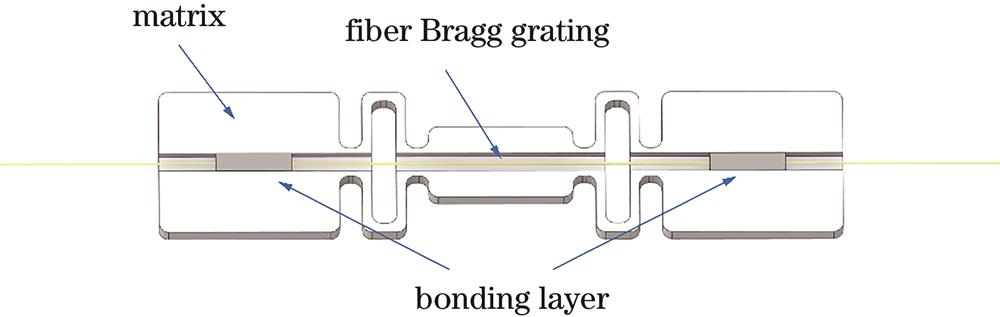
Fig. 1. Structure diagram of the FBG strain sensor
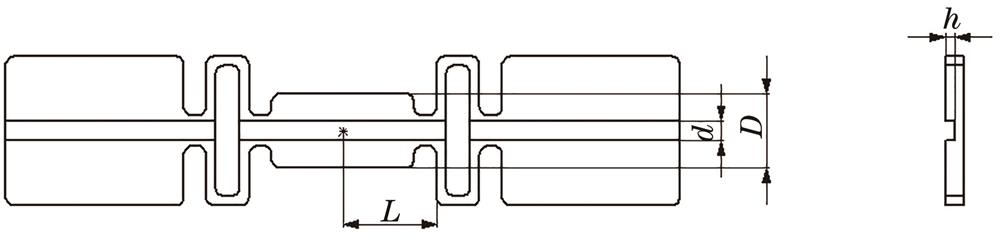
Fig. 2. Schematic diagram of dimension parameters of the FBG strain sensor
Fig. 3. Mesh division and load distribution of the senser
Fig. 4. Deformation distribution of the sensor with loop structure. (a) Deformation distribution of the FBG; (b) deformation distribution of the matrix
Fig. 5. Influence of different parameters on the strain sensitivity of the sensor. (a)
Fig. 6. Fabrication of the FBG sensor. (a) Matrix of the sensor; (b) workbench for processing optical fibers; (c) dispensing system; (d) fabricated fiber Bragg grating sensor
Fig. 7. Schematic diagram of the installation of the sensor
Fig. 8. Test system with applied temperature load and applied tensile load
Fig. 9. Results of temperature-controlled experiments and tensile experiments. (a) Sensor wavelength as a function of temperature; (b) sensor wavelength drift as a function of tensile load
Fig. 10. Load-strain curve of the sensor
|
Table 1. Physical parameters of the sensor
|
Table 2. Initial wavelengths of each sensor

Set citation alerts for the article
Please enter your email address
© Copyright 2018-2021 | Chinese Laser Press. All Rights Reserved 沪ICP备15018463号-20