Author Affiliations
1 Key Laboratory of Photoelectric Imaging Technology and System of Ministry of Education, School of Optics and Photonics, Beijing Institute of Technology, Beijing 100081, China2 National Satellite Meteorological Center, China Meteorological Administration, Beijing 100081, China3 Key Laboratory of Radiometric Calibration and Validation for Environmental Satellites, China Meteorological Administration, Beijing 100081, Chinashow less
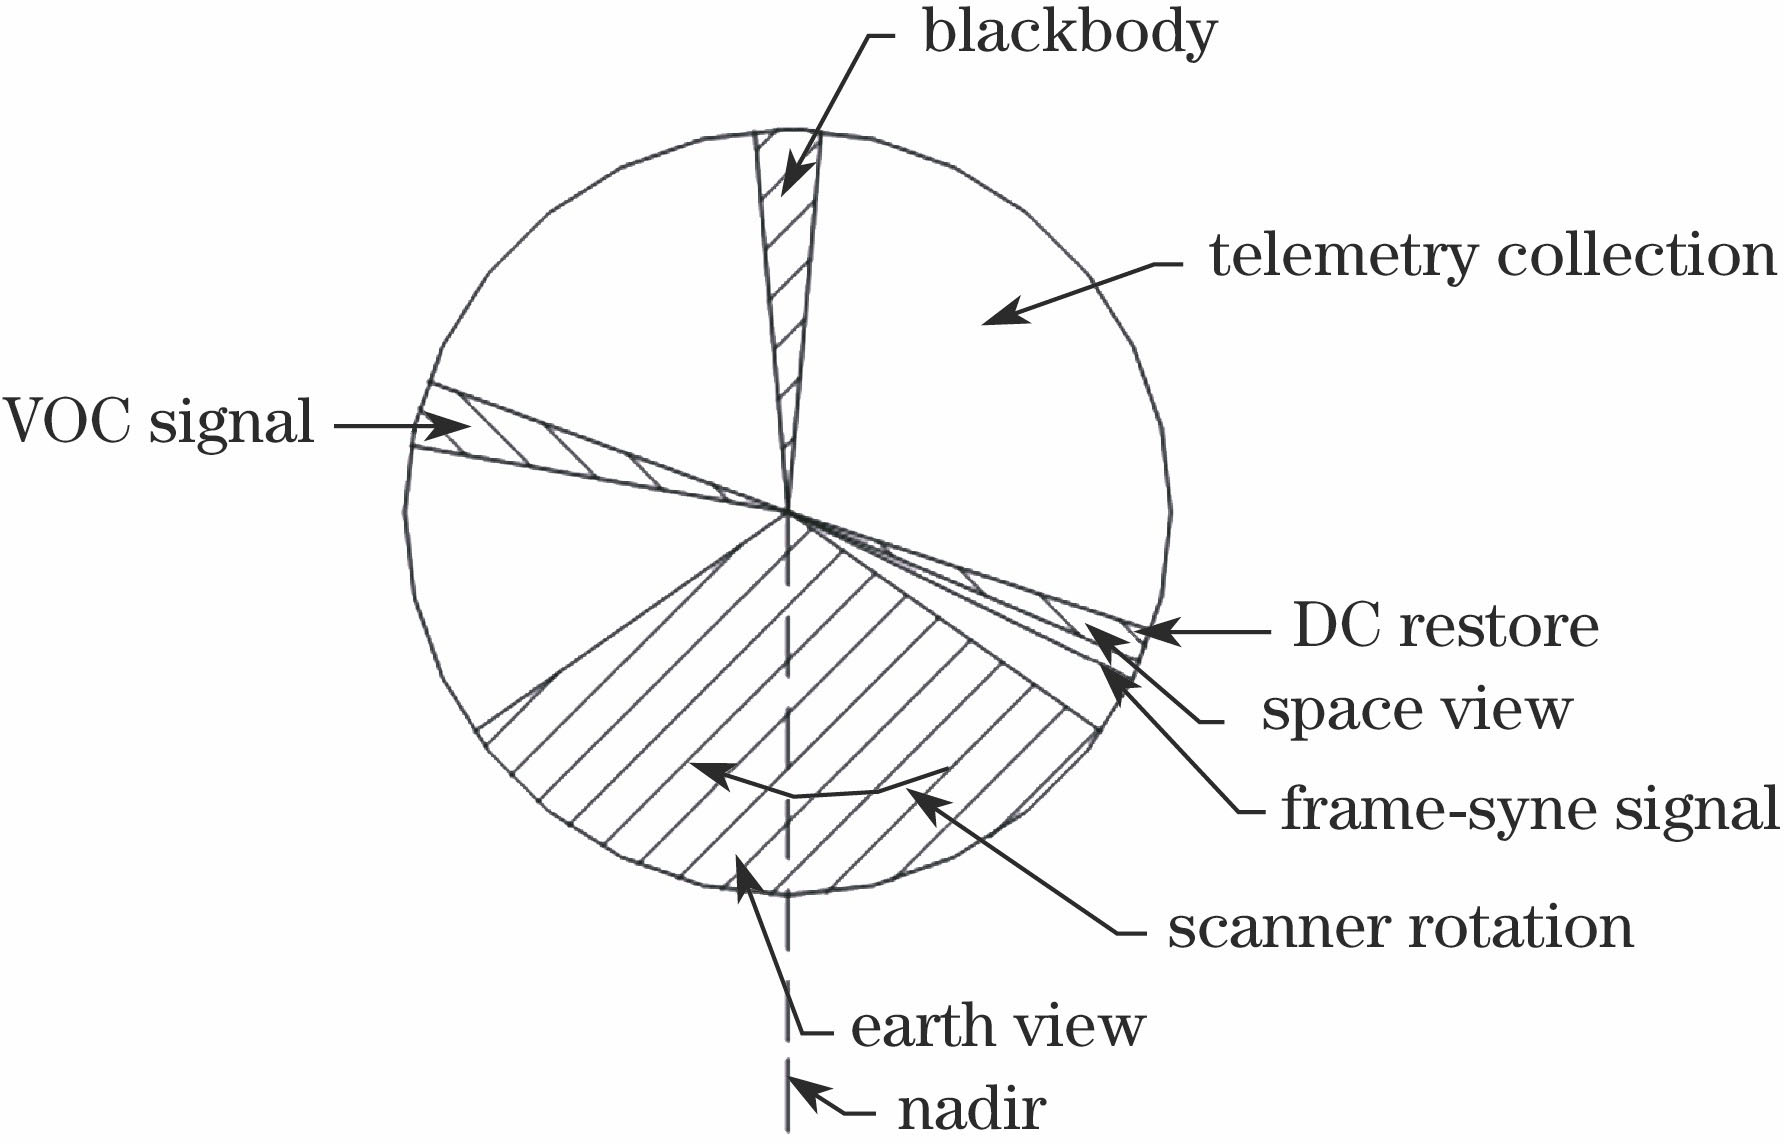
Fig. 1. MERSI scan pattern
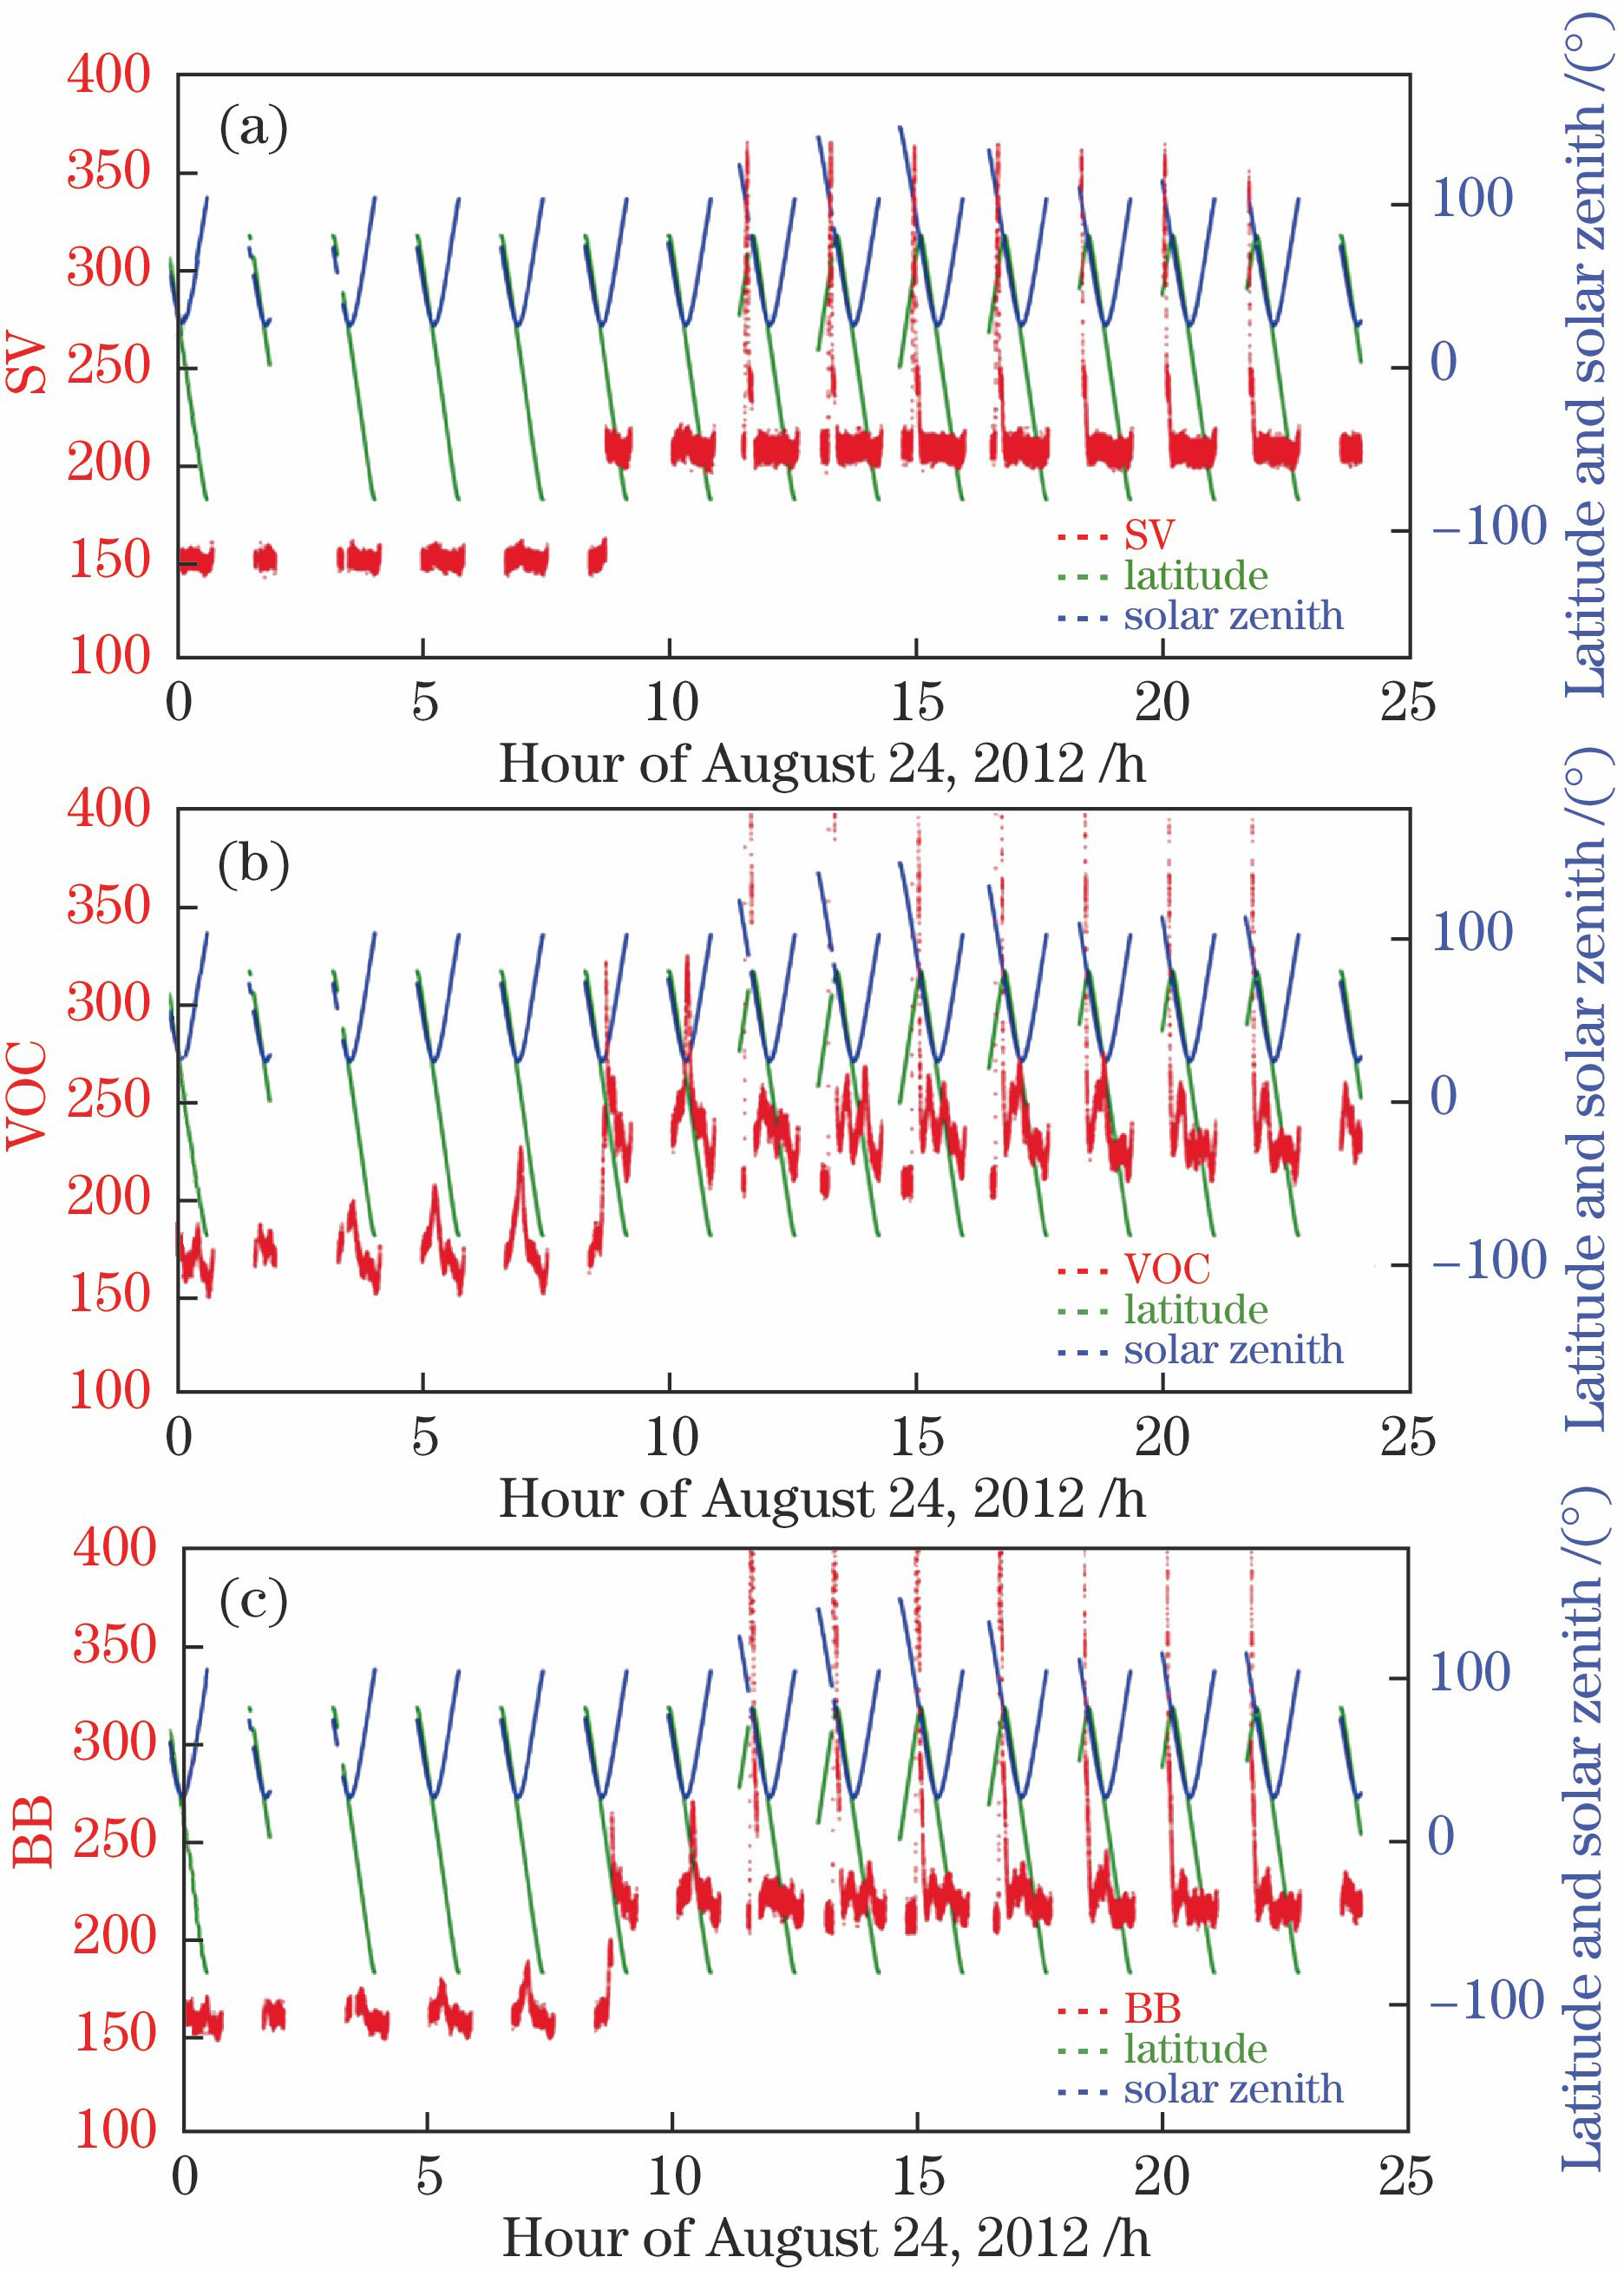
Fig. 2. Relation between daily variations of onboard calibration source targets and latitude and solar zenith angle at 2.13 μm. (a) SV; (b) VOC; (c) BB
Fig. 3. SV variation of 2.13 μm in 2012
Fig. 4. Gain classification process and resultsat 1.64 μm. (a) Original jump SV; (b) sorted jump SV; (c) sorted SV ratio; (d) SV ratio classification
Fig. 5. Normalized effect of SV at 1.64 and 2.13 μm during the lifetime. (a)(d) Daily average SV; (b)(e) normalized results using theoretical levels; (c)(f) normalized results using actual levels
Fig. 6. Normalized effect of onboard calibration source targets at 2.13 μm on August 24, 2012. Panels (a)(c)(e) SV, VOC, BB before normalization using actual levels; (b)(d)(f) SV, VOC, BB after normalization using actual levels
Fig. 7. Normalized effect of EV images (a)(b) at 1.64 μm on August 24, 2010 and (c)(d) at 2.13 μm on June 24, 2012
| Threshold value | δ1 | δ2 | δ3 | δ4 | α |
|---|
| Value | 0.06 | 0.09 | 1.5 | 0.03 | 0.002 | | δ basis | The minimum variation of eight preset gain levels (1, 1.1, 1.2, 1.3, 1.43, 1.57, 1.7, and 1.87) is 0.076 and the maximum is 0.87. | | α basis | The average variation of non-polluted SV values of 2.13 μm is 0.002 from October 1, 2010 to December 31, 2010. |
|
Table 1. Threshold value and basis of automatic identification and gain classification
| Date | Theoretical level | Actual level | Date | Theoretical level | Actual level |
|---|
| Before jump | | After jump | | Before jump | After jump | Before jump | After jump | | Before jump | After jump |
|---|
| 2009-03-02 | 1.0 | 1.1 | 1.00 | 1.09 | 2013-07-23 | 1.57 | 1.87 | 1.51 | 1.78 | | 2009-03-13 | 1.1 | 1.3 | 1.09 | 1.28 | 2013-07-29 | 1.87 | 1.43 | 1.78 | 1.39 | | 2009-05-29 | 1.3 | 1.87 | 1.28 | 1.78 | 2013-08-01 | 1.43 | 1.57 | 1.39 | 1.51 | | 2009-07-14 | 1.87 | 1.43 | 1.78 | 1.39 | 2013-08-02 | 1.57 | 1.87 | 1.51 | 1.78 | | 2009-08-17 | 1.43 | 1.57 | 1.39 | 1.51 | 2013-10-14 | 1.87 | 1.0 | 1.78 | 1.00 | | 2009-08-25 | 1.57 | 1.7 | 1.51 | 1.64 | 2014-02-24 | 1.0 | 1.1 | 1.00 | 1.09 | | 2009-08-26 | 1.7 | 1.87 | 1.64 | 1.78 | 2014-02-24 | 1.1 | 1.2 | 1.09 | 1.19 | | 2009-08-29 | 1.87 | 1.0 | 1.78 | 1.00 | 2014-02-25 | 1.2 | 1.3 | 1.19 | 1.28 | | 2009-09-06 | 1.0 | 1.1 | 1.00 | 1.09 | 2014-02-28 | 1.3 | 1.87 | 1.28 | 1.78 | | 2009-10-04 | 1.1 | 1.3 | 1.09 | 1.28 | 2014-02-28 | 1.87 | 1.0 | 1.78 | 1.00 | | 2009-10-09 | 1.3 | 1.43 | 1.28 | 1.39 | 2014-04-26 | 1.0 | 1.1 | 1.00 | 1.09 | | 2009-10-14 | 1.43 | 1.57 | 1.39 | 1.51 | 2014-04-27 | 1.1 | 1.2 | 1.09 | 1.19 | | 2009-10-30 | 1.57 | 1.7 | 1.51 | 1.64 | 2014-05-16 | 1.2 | 1.3 | 1.19 | 1.28 | | 2009-11-18 | 1.7 | 1.0 | 1.64 | 1.00 | 2014-05-21 | 1.3 | 1.43 | 1.28 | 1.39 | | 2010-03-06 | 1.0 | 1.1 | 1.00 | 1.09 | 2014-05-23 | 1.43 | 1.57 | 1.39 | 1.51 | | 2010-03-12 | 1.1 | 1.2 | 1.09 | 1.19 | 2014-05-23 | 1.57 | 1.87 | 1.51 | 1.78 | | 2010-03-29 | 1.2 | 1.3 | 1.19 | 1.28 | 2014-05-25 | 1.87 | 1.43 | 1.78 | 1.39 | | 2010-06-10 | 1.3 | 1.87 | 1.28 | 1.78 | 2014-05-26 | 1.43 | 1.57 | 1.39 | 1.51 | | 2010-08-24 | 1.87 | 1.0 | 1.78 | 1.00 | 2014-05-27 | 1.57 | 1.7 | 1.51 | 1.64 | | 2010-09-13 | 1.0 | 1.1 | 1.00 | 1.09 | 2014-05-29 | 1.7 | 1.87 | 1.64 | 1.78 | | 2012-03-18 | 1.1 | 1.2 | 1.09 | 1.19 | 2014-05-30 | 1.87 | 1.1 | 1.78 | 1.09 | | 2012-04-11 | 1.2 | 1.3 | 1.19 | 1.28 | 2014-05-31 | 1.1 | 1.2 | 1.09 | 1.19 | | 2012-05-22 | 1.3 | 1.0 | 1.28 | 1.00 | 2014-06-02 | 1.2 | 1.3 | 1.19 | 1.28 | | 2012-05-30 | 1.0 | 1.1 | 1.00 | 1.09 | 2014-06-05 | 1.3 | 1.43 | 1.28 | 1.39 | | 2012-06-24 | 1.1 | 1.3 | 1.09 | 1.28 | 2014-06-06 | 1.43 | 1.57 | 1.39 | 1.51 | | 2012-07-02 | 1.3 | 1.87 | 1.28 | 1.78 | 2014-06-06 | 1.57 | 1.7 | 1.51 | 1.64 | | 2012-07-04 | 1.87 | 1.0 | 1.78 | 1.00 | 2014-06-06 | 1.7 | 1.87 | 1.64 | 1.78 | | 2012-07-08 | 1.0 | 1.1 | 1.00 | 1.09 | 2014-06-10 | 1.87 | 1.0 | 1.78 | 1.00 | | 2012-08-22 | 1.1 | 1.2 | 1.09 | 1.19 | 2014-06-16 | 1.0 | 1.1 | 1.00 | 1.09 | | 2012-08-23 | 1.2 | 1.3 | 1.19 | 1.28 | 2014-06-28 | 1.1 | 1.2 | 1.09 | 1.19 | | 2012-08-24 | 1.3 | 1.43 | 1.28 | 1.39 | 2014-07-03 | 1.2 | 1.3 | 1.19 | 1.28 | | 2012-09-04 | 1.43 | 1.57 | 1.39 | 1.51 | 2014-07-03 | 1.3 | 1.87 | 1.28 | 1.78 | | 2012-09-09 | 1.57 | 1.87 | 1.51 | 1.78 | 2014-07-04 | 1.87 | 1.0 | 1.78 | 1.00 | | 2012-09-10 | 1.87 | 1.0 | 1.78 | 1.00 | 2014-07-06 | 1.0 | 1.1 | 1.00 | 1.09 | | 2012-10-29 | 1.0 | 1.1 | 1.00 | 1.09 | 2014-07-07 | 1.1 | 1.2 | 1.09 | 1.19 | | 2012-11-14 | 1.1 | 1.2 | 1.09 | 1.19 | 2014-07-12 | 1.2 | 1.3 | 1.19 | 1.28 | | 2012-12-31 | 1.2 | 1.3 | 1.19 | 1.28 | 2014-07-14 | 1.3 | 1.57 | 1.28 | 1.51 | | 2013-01-03 | 1.3 | 1.43 | 1.28 | 1.39 | 2014-07-15 | 1.57 | 1.7 | 1.51 | 1.64 | | 2013-01-05 | 1.43 | 1.57 | 1.39 | 1.51 | 2014-07-23 | 1.7 | 1.87 | 1.64 | 1.78 | | 2013-01-08 | 1.57 | 1.87 | 1.51 | 1.78 | 2014-07-24 | 1.87 | 1.43 | 1.78 | 1.39 | | 2013-01-15 | 1.87 | 1.0 | 1.78 | 1.00 | 2014-07-24 | 1.43 | 1.57 | 1.39 | 1.51 | | 2013-03-07 | 1.0 | 1.1 | 1.00 | 1.09 | 2014-07-24 | 1.57 | 1.7 | 1.51 | 1.64 | | 2013-06-14 | 1.1 | 1.3 | 1.09 | 1.28 | 2014-07-27 | 1.7 | 1.0 | 1.64 | 1.00 | | 2013-07-06 | 1.3 | 1.87 | 1.28 | 1.78 | 2014-07-29 | 1.0 | 1.1 | 1.00 | 1.09 | | 2013-07-20 | 1.87 | 1.43 | 1.78 | 1.39 | 2014-07-30 | 1.1 | 1.2 | 1.09 | 1.19 | | 2013-07-23 | 1.43 | 1.57 | 1.39 | 1.51 | | | | | |
|
Table 2. Detailed information of all gain jumps at 1.64 μm
| Date | Theoretical level | Actual level | Date | Theoretical level | Actual level |
|---|
| Before jump | | After jump | | Before jump | After jump | Before jump | After jump | | Before jump | After jump |
|---|
| 2009-03-02 | 1.0 | 1.1 | 1.00 | 1.09 | 2012-04-11 | 1.0 | 1.1 | 1.00 | 1.09 | | 2009-08-24 | 1.1 | 1.3 | 1.09 | 1.26 | 2012-05-22 | 1.1 | 1.0 | 1.09 | 1.00 | | 2009-09-10 | 1.3 | 1.7 | 1.26 | 1.77 | 2012-06-20 | 1.0 | 1.1 | 1.00 | 1.09 | | 2009-10-30 | 1.7 | 1.0 | 1.77 | 1.00 | 2012-06-24 | 1.1 | 1.3 | 1.09 | 1.26 | | 2010-03-06 | 1.0 | 1.1 | 1.00 | 1.09 | 2012-08-24 | 1.3 | 1.87 | 1.26 | 1.77 | | 2010-03-12 | 1.1 | 1.2 | 1.09 | 1.16 | 2013-06-21 | 1.87 | 1.7 | 1.77 | 1.66 | | 2010-05-31 | 1.2 | 1.3 | 1.16 | 1.26 | 2013-07-29 | 1.7 | 1.87 | 1.66 | 1.77 | | 2010-08-24 | 1.3 | 1.7 | 1.26 | 1.77 | 2014-02-28 | 1.87 | 1.43 | 1.77 | 1.42 | | 2010-09-13 | 1.7 | 1.0 | 1.77 | 1.00 | 2014-04-26 | 1.43 | 1.57 | 1.42 | 1.56 |
|
Table 3. Detailed information of all gain jumps at 2.13 μm
| Level | Index | 1 | 2 | 3 | 4 | 5 | 6 | 7 | 8 | Average |
|---|
| 1.64 μm | Theoretical | 1.0 | 1.1 | 1.2 | 1.3 | 1.43 | 1.57 | 1.7 | 1.87 | | | Actual | 1.00 | 1.09 | 1.19 | 1.28 | 1.39 | 1.51 | 1.64 | 1.78 | | | Deviation /% | 0 | 0.92 | 0.84 | 1.56 | 2.88 | 3.97 | 3.66 | 5.06 | 2.36 | | 2.13 μm | Theoretical | 1.0 | 1.1 | 1.2 | 1.3 | 1.43 | 1.57 | 1.7 | 1.87 | | | Actual | 1.00 | 1.09 | 1.16 | 1.26 | 1.42 | 1.56 | 1.66 | 1.77 | | | Deviation /% | 0 | 0.92 | 3.45 | 3.17 | 0.70 | 0.64 | 2.41 | 5.65 | 2.12 |
|
Table 4. Deviation between theoretical and actual levels at 1.64 μm and 2.13 μm