• Spectroscopy and Spectral Analysis
  • Vol. 42, Issue 5, 1366 (2022)
Yan-de LIU*, Mao-peng LI, Jun HU, Zhen XU, and Hui-zhen CUI
Author Affiliations
  • School of Mechanical and Electrical Engineering, East China Jiaotong University, Nanchang 330013, China
  • show less
    DOI: 10.3964/j.issn.1000-0593(2022)05-1366-06 Cite this Article
    Yan-de LIU, Mao-peng LI, Jun HU, Zhen XU, Hui-zhen CUI. Detection of Citrus Granulation Based on Near-Infrared Hyperspectral Data[J]. Spectroscopy and Spectral Analysis, 2022, 42(5): 1366 Copy Citation Text show less
    Three different granulation degrees of navel orange in southern Jiangxi(a): None; (b): Mild; (c): Moderate
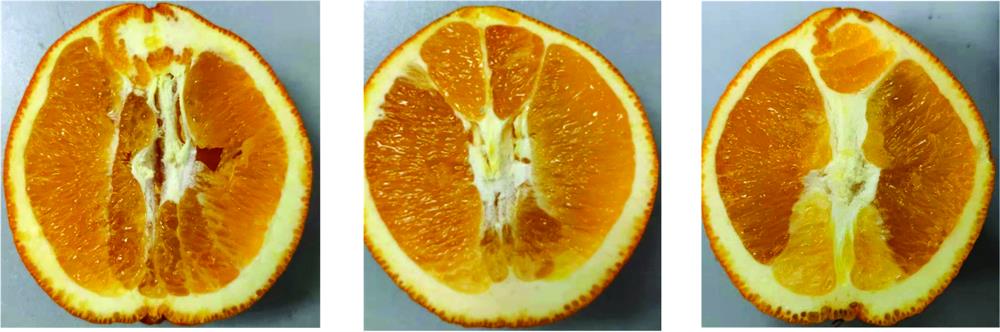
    Fig. 1. Three different granulation degrees of navel orange in southern Jiangxi
    (a): None; (b): Mild; (c): Moderate
    Hyperspectral equipment imaging device(a): Schematic diagram; (b): Picture
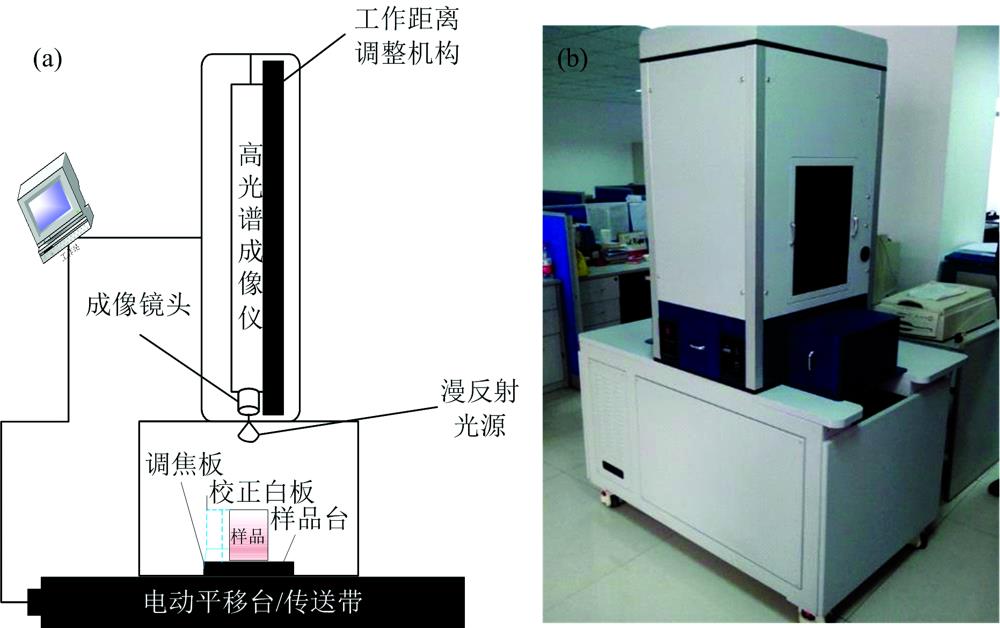
    Fig. 2. Hyperspectral equipment imaging device
    (a): Schematic diagram; (b): Picture
    Modeling flow chart of detection for navel oranges with different granulation degrees
    Fig. 3. Modeling flow chart of detection for navel oranges with different granulation degrees
    Original mean reflectance spectra of navel oranges with three granulation degrees
    Fig. 4. Original mean reflectance spectra of navel oranges with three granulation degrees
    Cumulative contribution rates of the first 20 principal components of citrus hyperspectral data
    Fig. 5. Cumulative contribution rates of the first 20 principal components of citrus hyperspectral data
    SPA wavelength variable selection results
    Fig. 6. SPA wavelength variable selection results
    UVE variable screening stability result graph
    Fig. 7. UVE variable screening stability result graph
    Prediction results of UVE-LS-SVM model based on RBF-Kernel
    Fig. 8. Prediction results of UVE-LS-SVM model based on RBF-Kernel
    Degree of
    granulation
    Sample
    code
    Total number
    of samples
    Number of training
    set samples
    Number of test
    set samples
    None117413143
    Mild217413143
    Moderate317413143
    Table 1. Classification of training sets and prediction sets and sample codes of different coffee beans
    ModelVariable selection
    methods
    Number of
    variable
    PCsRcRMSECRpRMSEPError rate of
    prediction set/%
    PLS-DAOriginal data176120.9100.2100.8900.2817.55
    PCA650.7080.4420.6590.47425.58
    SPA1770.8320.3300.8270.33815.55
    UVE5470.9120.2440.8950.2615.38
    Table 2. Comparison of PLS-DA models based on different dimension reduction methods
    MethodsNo. of
    variable
    RBF-KernelLIN-Kernel
    γ, σ2Error rate of
    training set/%
    Error rate of
    test set/%
    γError rate of
    training set/%
    Error rate of
    test set/%
    Full spectrum1761.796×104, 672.2231.274.651.5682.294.65
    PCA66.781, 0.7351.781.551.0395.0917.05
    SPA171.362×104, 122.7750.762.331.1110.764.65
    UVE541.802×104, 500.1160%0.78%1.6670.251.55
    Table 3. Comparison of model performance between different dimension reduction methods and LS-SVM method
    Yan-de LIU, Mao-peng LI, Jun HU, Zhen XU, Hui-zhen CUI. Detection of Citrus Granulation Based on Near-Infrared Hyperspectral Data[J]. Spectroscopy and Spectral Analysis, 2022, 42(5): 1366
    Download Citation