
Yuan GUO, Lanlan WU, Shiwei JING. A Phase-truncated Fourier Transform Asymmetric Optical Compression and Encryption System[J]. Acta Photonica Sinica, 2022, 51(6): 0610001
- Acta Photonica Sinica
- Vol. 51, Issue 6, 0610001 (2022)
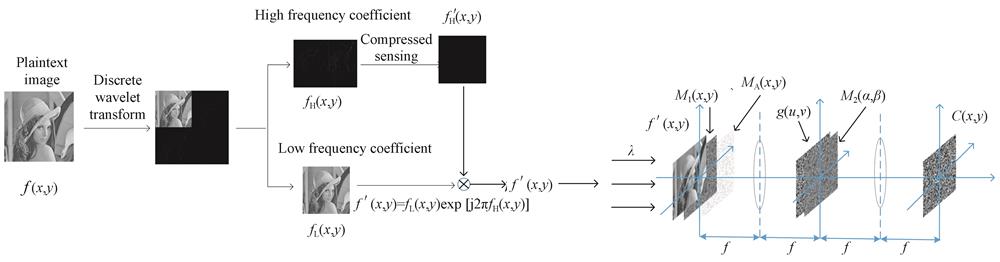
Fig. 1. Working principle of PTFT optical compression encryption system
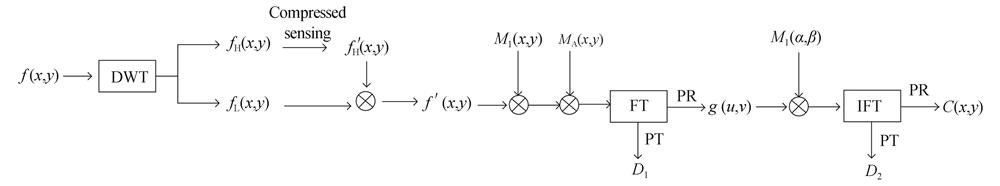
Fig. 2. Encryption flowchart of PTFT system based on compressed sensing
Fig. 3. Decryption flow of PTFT system based on compressed sensing
Fig. 4. Encryption and decryption image of the encryption system
Fig. 5. Grayscale histogram
Fig. 6. Correlation distribution of adjacent pixels
Fig. 7. The reconstructed image with different compression methods and different scales
Fig. 8. Comparison diagram of attack cracking and Mean Square Error(MSE)comparison chart
Fig. 9. Comparison diagram of attack cracking
Fig. 10. Decrypted images of salt and pepper noise interference under different noise ratios
Fig. 11. Decrypted images with Gaussian noise interference under different variances
Fig. 12. Cut encrypted and decrypted images of different sizes
Fig. 13. Selected plaintext attack effect diagram
|
Table 1. Correlation coefficient analysis
|
Table 2. Different methods of compressing different ratios of peak signal-to-noise ratio
|
Table 3. Comparative analysis of time and key transmission volume

Set citation alerts for the article
Please enter your email address
© Copyright 2018-2021 | Chinese Laser Press. All Rights Reserved 沪ICP备15018463号-20