
Ye-Yan HUANG, Kai XU, Bo WU, Peng LI, Ke-Ke CHANG, Feng HUANG, Qing HUANG. Review on Metastable Phase Diagrams: Application Roles in Specialty Ceramic Coatings [J]. Journal of Inorganic Materials, 2020, 35(1): 19
- Journal of Inorganic Materials
- Vol. 35, Issue 1, 19 (2020)
![The phase diagram of TiAlN (a) The stable TiN-AlN pseudo binary phase diagram[61], among which the Al solubilities of fcc phase is negligible; (b) The critical Al solubilities (xmax) in Ti1-xAlxN by different calculation methods compared with the experimental data[35-37, 40-41, 49-52, 61-66]](/richHtml/jim/2020/35/1/19/img_1.png)
1. The phase diagram of TiAlN (a) The stable TiN-AlN pseudo binary phase diagram[61], among which the Al solubilities of fcc phase is negligible; (b) The critical Al solubilities (x max) in Ti1-x Alx N by different calculation methods compared with the experimental data[35-37, 40-41, 49-52, 61-66]
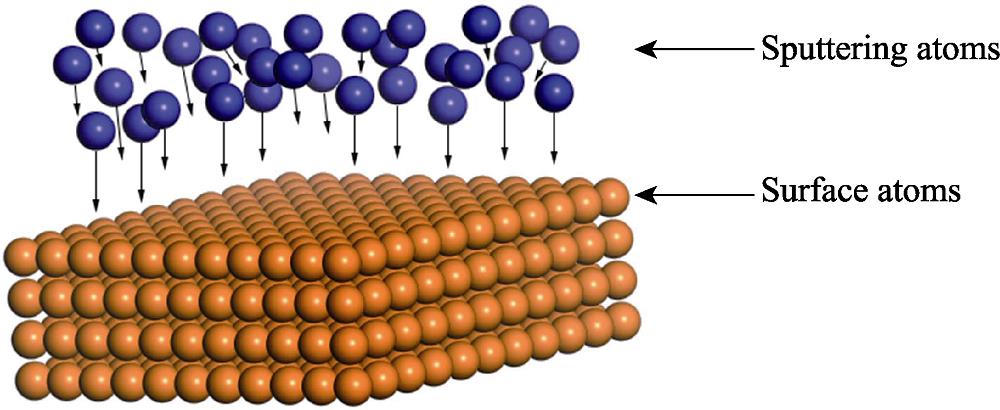
2. Schematic diagram of the atomic models in the thin films prepared by magnetron sputtering
3. Structure of the coatings deposited at room temperature compared with the phase diagrams of (a) Al-Cu[59,71], (b) Al-Ni[59,72] and (c) Al-Fe[59,70]
4. (a) Diffusion distance versus temperature of Cu-11.5at% Sn obtained by Saunders and Miodownik[60] based on diffusion equation; (b) Diffusion distance versus temperature of Cu-19.5at% Sn[60] obtained by Saunders and Miodownik based on diffusion equation; (c) Phase diagram of the Cu-Sn system[73]
5. Flow chart of simulating metastable phase formation diagram of PVD coatings[58]
6. (a) Calculated and predicted metastable Cu-W phase formation diagram compared with the experimental data[58]; (b) Calculated and predicted metastable Cu-V phase formation diagram compared with the experimental data[58]; (c) Phase diagram of the Cu-W system[74]; (d) Phase diagram of the Cu-V system[75]
7. (a) Phase diagram of the Pt-Ir[86] system; (b) Phase diagram of the Pt-Au system[87]; (c) Phase formation of the Pt-Ir[85] sputtered thin films; (d) Phase formation of the Pt-Au[85] sputtered thin films
8. Metastable Ti1-x Alx N phase formation diagrams (a) The predicted diagrams at different power densities; (b) The predicted diagram compared with the experimental data with power density of 2.3 W·cm-2 at 100-550 ℃; (c) The predicted diagram compared with the experimental data with power density of 4.6 W·cm-2 at 100-550 ℃; (d) The predicted diagram compared with the experimental data with power density of 6.8 W·cm-2 at 100-550 ℃

Set citation alerts for the article
Please enter your email address
© Copyright 2018-2021 | Chinese Laser Press. All Rights Reserved 沪ICP备15018463号-20