• Chinese Optics Letters
  • Vol. 18, Issue 10, 101702 (2020)
Xinkun Wang1、2, Kedi Xiong1、2、*, Xin Jin1、2, and Sihua Yang1、2
Author Affiliations
  • 1MOE Key Laboratory of Laser Life Science & Institute of Laser Life Science, College of Biophotonics, South China Normal University, Guangzhou 510631, China
  • 2Guangdong Provincial Key Laboratory of Laser Life Science, College of Biophotonics, South China Normal University, Guangzhou 510631, China
  • show less
    DOI: 10.3788/COL202018.101702 Cite this Article Set citation alerts
    Xinkun Wang, Kedi Xiong, Xin Jin, Sihua Yang. Tomography-assisted Doppler photoacoustic microscopy: proof of concept[J]. Chinese Optics Letters, 2020, 18(10): 101702 Copy Citation Text show less
    (a) Beam geometry of PA flow speed measurement. US, ultrasound; UST, ultrasound transducer. (b) Geometry of the Doppler angle by superimposing of a set of PA images to form volumetric images.
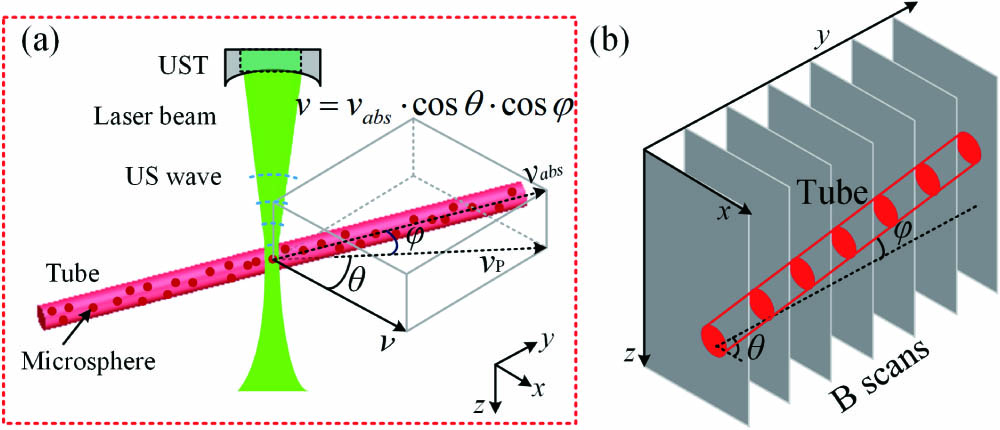
    Fig. 1. (a) Beam geometry of PA flow speed measurement. US, ultrasound; UST, ultrasound transducer. (b) Geometry of the Doppler angle by superimposing of a set of PA images to form volumetric images.
    (a) Schematic of the photoacoustic imaging system. BS, beam splitter; DAQ, data acquisition card; L1 and L2, lenses; M1 and M2, mirrors; Ob, objective; PD, photodiode; PH, pinhole; WT, water tank. (b) Original PA signal along the dashed line of the inserted photograph of a blade, and its line spread function whose full width at half-maximum was measured to be ∼7 μm. (c) The lateral resolution versus the axial distance. (d) Pulse-echo response of the ultrasonic transducer at the focus. (e) The signal-to-noise ratio (SNR) versus the axial distance.
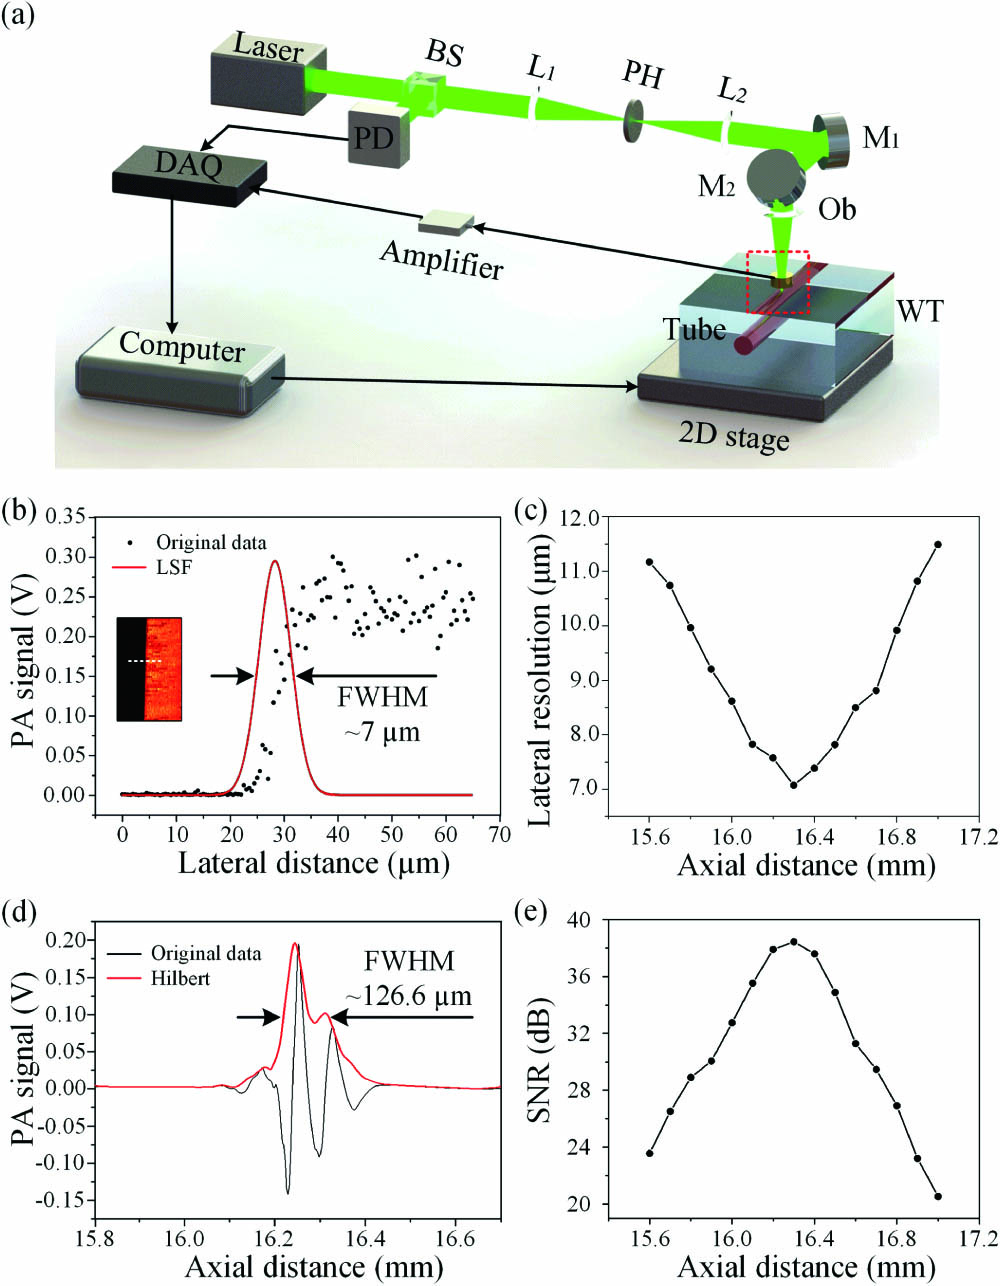
    Fig. 2. (a) Schematic of the photoacoustic imaging system. BS, beam splitter; DAQ, data acquisition card; L1 and L2, lenses; M1 and M2, mirrors; Ob, objective; PD, photodiode; PH, pinhole; WT, water tank. (b) Original PA signal along the dashed line of the inserted photograph of a blade, and its line spread function whose full width at half-maximum was measured to be ∼7 μm. (c) The lateral resolution versus the axial distance. (d) Pulse-echo response of the ultrasonic transducer at the focus. (e) The signal-to-noise ratio (SNR) versus the axial distance.
    Photoacoustic (a) maximum amplitude projection and (b) transverse flow of a phantom. (c) Measured bandwidth with the Doppler angle of 90° versus preset speed with consecutive A-lines of 2/4/6/8/10. Measured bw., measured bandwidth. (d) Measured maximum non-saturated bandwidth with the Doppler angle of 90° versus consecutive A-lines of 2 to 30. Max. ms., maximum measured speed; Num. of A-line for corr. cal., number of A-line for correlation calculation. (e) Ten representative consecutive A-lines.
    Fig. 3. Photoacoustic (a) maximum amplitude projection and (b) transverse flow of a phantom. (c) Measured bandwidth with the Doppler angle of 90° versus preset speed with consecutive A-lines of 2/4/6/8/10. Measured bw., measured bandwidth. (d) Measured maximum non-saturated bandwidth with the Doppler angle of 90° versus consecutive A-lines of 2 to 30. Max. ms., maximum measured speed; Num. of A-line for corr. cal., number of A-line for correlation calculation. (e) Ten representative consecutive A-lines.
    Measurement of Doppler angle. (a) Illustration of Doppler angles (55°, 65°, 75°, 85°, and 90°) derived from volumetric image. (b) Comparison of preset and measured Doppler angles. Meas. angle, measured angle. (c) Measured transverse speed profiles along the cross section of the tube with different angles. (d) Measured transverse speed profiles at the center of the tube with different angles.
    Fig. 4. Measurement of Doppler angle. (a) Illustration of Doppler angles (55°, 65°, 75°, 85°, and 90°) derived from volumetric image. (b) Comparison of preset and measured Doppler angles. Meas. angle, measured angle. (c) Measured transverse speed profiles along the cross section of the tube with different angles. (d) Measured transverse speed profiles at the center of the tube with different angles.
    Results of artery and vein phantom experiments. (a) Volumetric and (b) MAP images of two tubes. (c) Transverse flow speed image of the two tubes. (d) Absolute speed mapping of the two tubes, which was calculated by combining transverse flows and Doppler angles within the tube-based area. (e) Doppler angles of the two tubes. (f) Profiles of transverse (blue curve) and absolute (red curve) speed of the dashed line in (c) and (d).
    Fig. 5. Results of artery and vein phantom experiments. (a) Volumetric and (b) MAP images of two tubes. (c) Transverse flow speed image of the two tubes. (d) Absolute speed mapping of the two tubes, which was calculated by combining transverse flows and Doppler angles within the tube-based area. (e) Doppler angles of the two tubes. (f) Profiles of transverse (blue curve) and absolute (red curve) speed of the dashed line in (c) and (d).
    Xinkun Wang, Kedi Xiong, Xin Jin, Sihua Yang. Tomography-assisted Doppler photoacoustic microscopy: proof of concept[J]. Chinese Optics Letters, 2020, 18(10): 101702
    Download Citation