
Kathleen McGarvey, Pablo Bianucci. General treatment of dielectric perturbations in optical rings[J]. Advanced Photonics Nexus, 2022, 1(1): 016004
- Advanced Photonics Nexus
- Vol. 1, Issue 1, 016004 (2022)
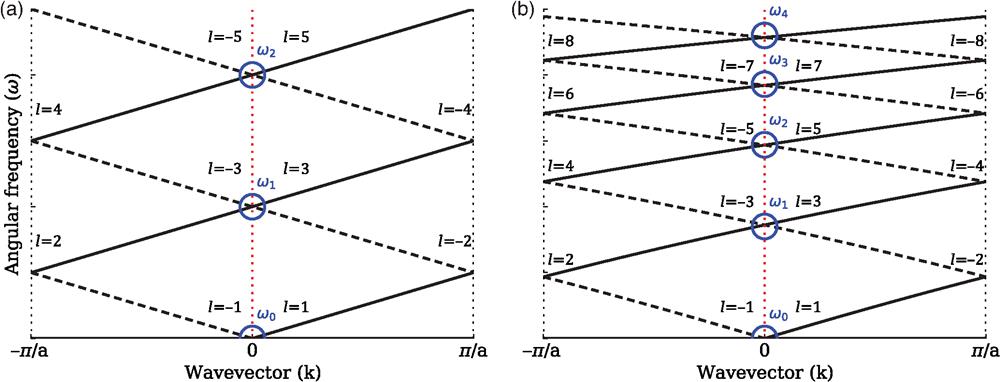
Fig. 1. Photonic bands in an unperturbed ring resonator, plotted in a folded-zone diagram. A solid line corresponds to forward propagating bands, and a dashed line to backward-propagating ones. Each band is labeled with its corresponding band index. The resonances are marked when the bands cross the
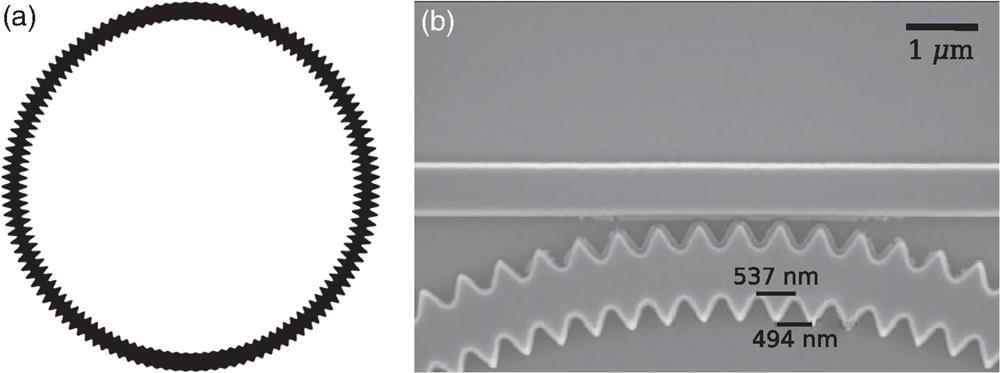
Fig. 2. (a) Schematic of a waveguide-based ring having a width modulation with only two different non-zero Fourier coefficients. (b) Scanning electron microscope image of a fabricated silicon nitride ring and its coupling waveguide.
Fig. 3. Experimental transmission spectrum of four different rings with different perturbation amplitudes. The bottom spectrum is that of an unperturbed ring, and the perturbation amplitudes increase going up (corresponding to 0-, 120-, 130-, 140-, and 150-nm width modulation amplitudes). The black lines correspond to the experimental data, and the thin red lines are the Lorentzian dips required to fit each corresponding mode. The traces are offset for visibility.
|
Table 1. Resonance splittings, Q q = 61
|
Table 2. Resonance splittings, Q q = 62

Set citation alerts for the article
Please enter your email address
© Copyright 2018-2021 | Chinese Laser Press. All Rights Reserved 沪ICP备15018463号-20