


 )
) )
) (%)
(%) (at.%)
 )
)
J.-C. Chanteloup, M. Arzakantsyan, and S. Marrazzo, "Defining the optimal gradient doped Yb3+:YAG disk for room and low temperature diode pumped solid-state laser operations," High Power Laser Sci. Eng. 2, 04000e35 (2014)
- High Power Laser Science and Engineering
- Vol. 2, Issue 4, 04000e35 (2014)
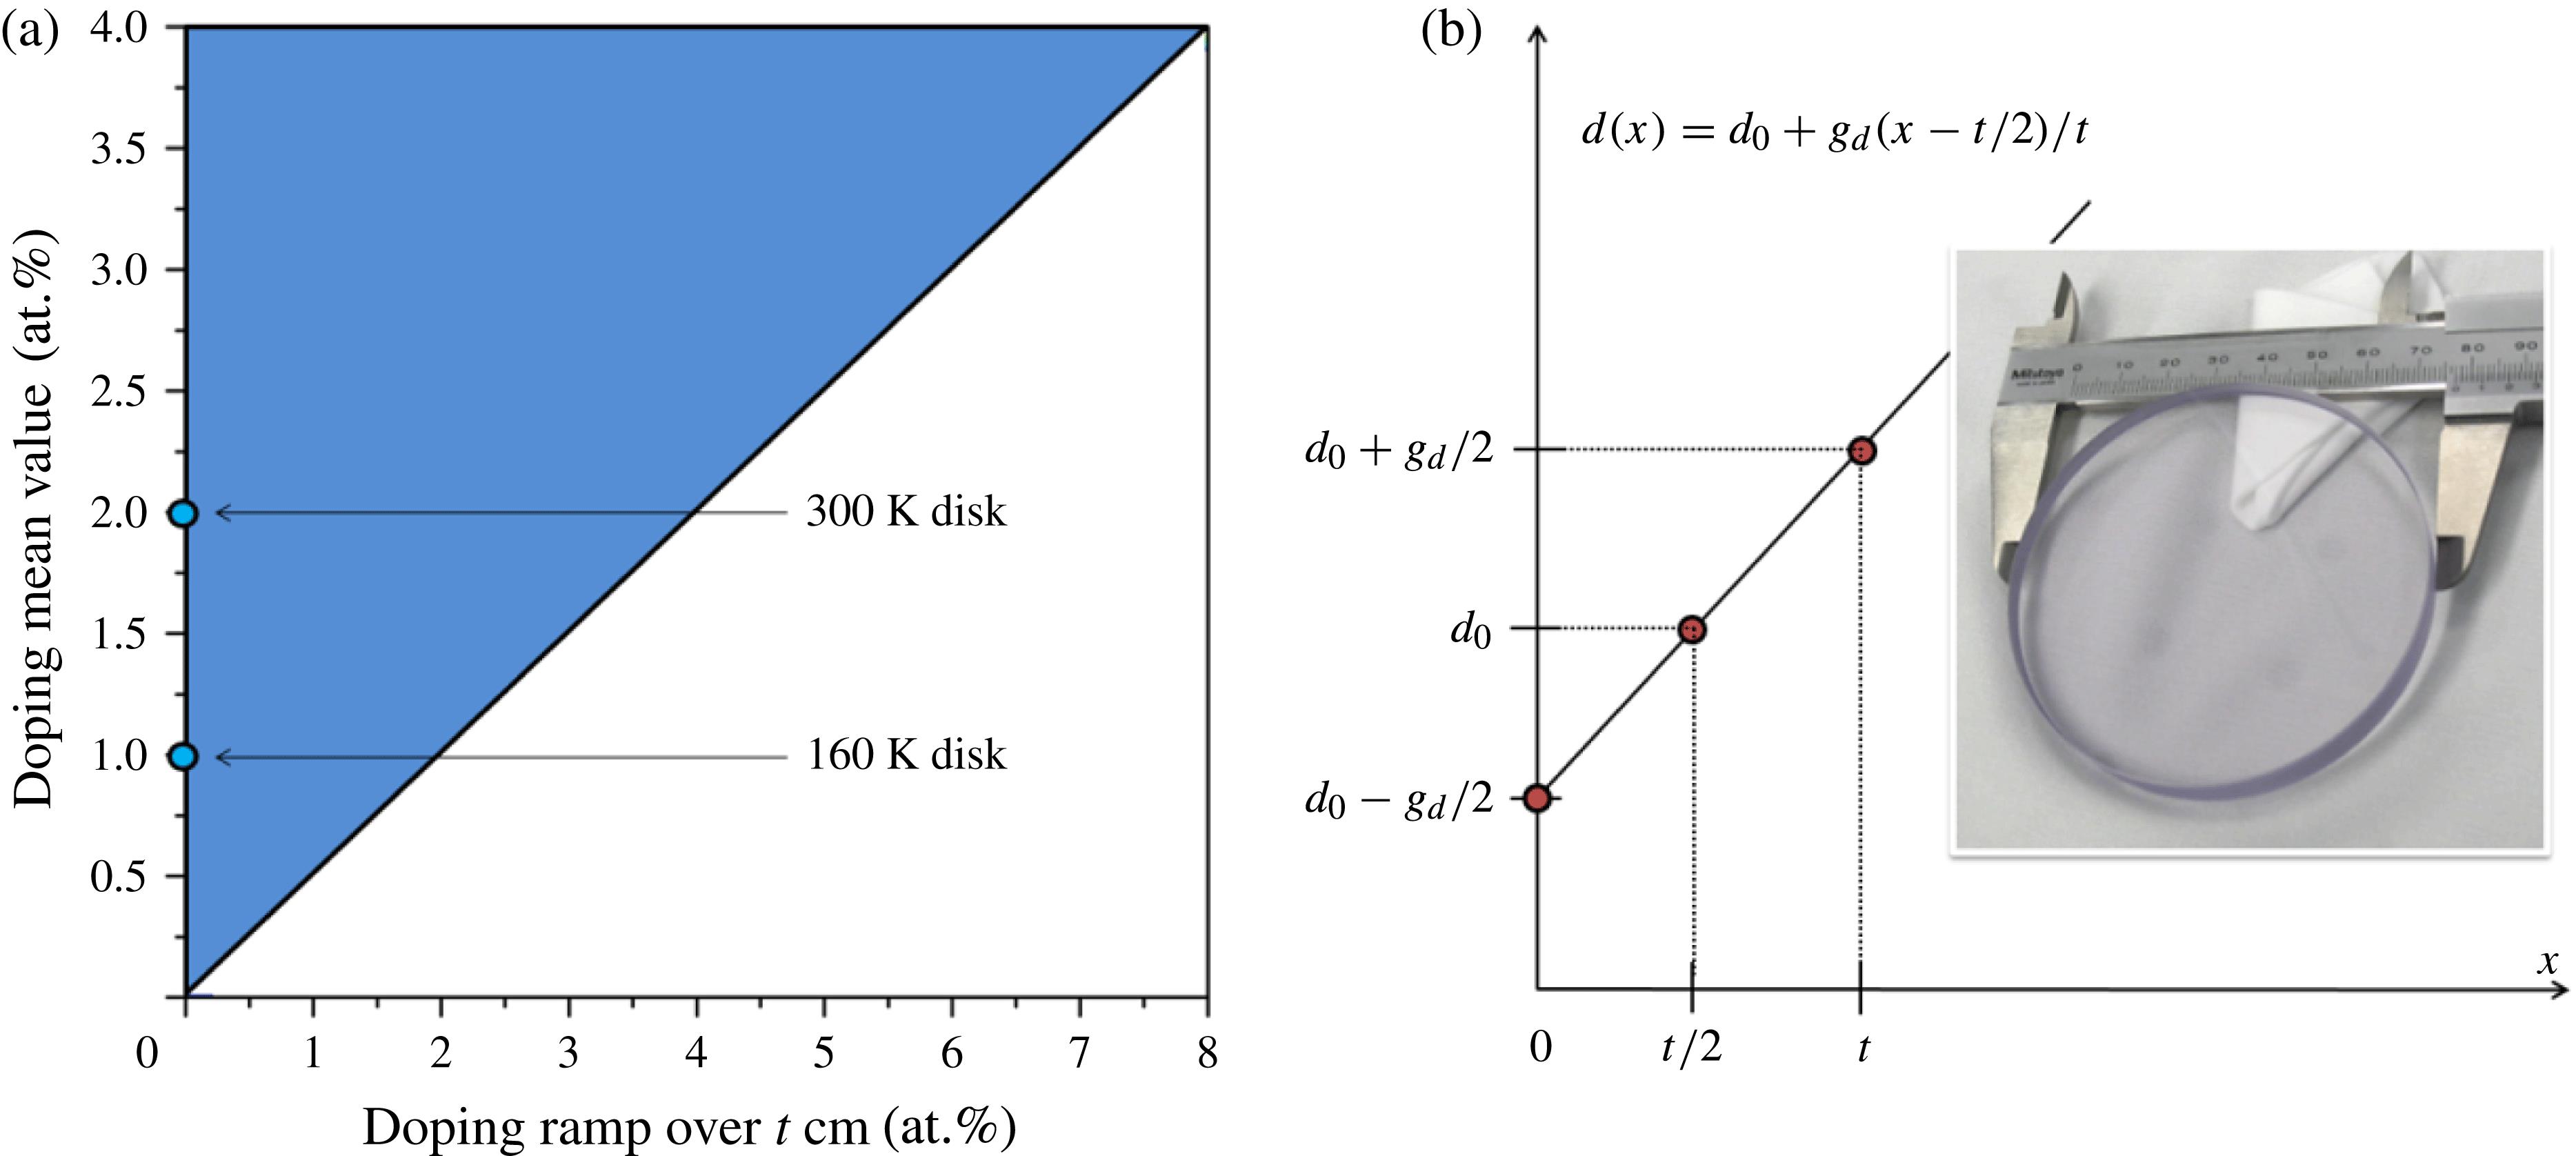
Fig. 1. (a) The workspace defined by the disk doping ramp over its thickness and the doping mean value. (b) The linear doping equation  . The inset shows the 77 mm disk used for the 160 K Lucia active mirror amplifier; it corresponds to the blue circle with coordinates (0, 1) in the workspace; the other circle (0, 2) refers to the 300 K disk. Both positions are qualified as
 WP .
. The inset shows the 77 mm disk used for the 160 K Lucia active mirror amplifier; it corresponds to the blue circle with coordinates (0, 1) in the workspace; the other circle (0, 2) refers to the 300 K disk. Both positions are qualified as ![The thermal evolution of the absorption cross section between 90 and 300 K for an HDC grown homogeneously 1 at.% doped 1 cm thick Yb:YAG crystal. The data in (a) are collected at 940 nm whereas those in (b) correspond to the 1030 nm absorption peak. The red dots refer to data from Fan[7] whereas the green ones refer to data from Brown[8].](/richHtml/hpl/2014/2/4/04000e35/img_2.gif)
Fig. 2. The thermal evolution of the absorption cross section between 90 and 300 K for an HDC grown homogeneously 1 at.% doped 1 cm thick Yb:YAG crystal. The data in (a) are collected at 940 nm whereas those in (b) correspond to the 1030 nm absorption peak. The red dots refer to data from Fan[7] whereas the green ones refer to data from Brown[8].
Fig. 3. Stored energy density map versus doping ramp and mean value. For each specific doping ramp, a minimum average doping value exists below which this doping ramp is not defined; this explains the map’s white triangular area. The iso-energy density  line above which the requested energetic performance will be reached is drawn.
line above which the requested energetic performance will be reached is drawn. Fig. 4. (a) Maximum gain map versus doping ramp and mean value. The 1.33  threshold iso-gain curve is drawn in solid back. Below this value, ASE triggered parasitic oscillations are expected to be severely limited, guaranteeing a satisfactory efficiency for the amplifier. The iso-energy density
  line is also drawn (dashed line). The bottom right inset gives an enlarged view of the AoI. (b) Small signal gain distribution over the 7 mm thick crystal for the current 2 at.% constant doped crystal (black) and optimum 1.9 at.% average/0.9 at.% doping ramp crystal (red).
threshold iso-gain curve is drawn in solid back. Below this value, ASE triggered parasitic oscillations are expected to be severely limited, guaranteeing a satisfactory efficiency for the amplifier. The iso-energy density line is also drawn (dashed line). The bottom right inset gives an enlarged view of the AoI. (b) Small signal gain distribution over the 7 mm thick crystal for the current 2 at.% constant doped crystal (black) and optimum 1.9 at.% average/0.9 at.% doping ramp crystal (red). Fig. 5. (a) Gain contrast  map versus doping ramp and mean value. The red rectangle gives the AoI. The iso-energy density
  line is dashed. The optimum region is white dashed. The Lucia current operating point
 WP is marked with the blue circle (27%) and the optimum one is marked in yellow (2.4%). (b) The gain profiles for the blue and yellow points.
map versus doping ramp and mean value. The red rectangle gives the AoI. The iso-energy density line is dashed. The optimum region is white dashed. The Lucia current operating point Fig. 6. (a) Stored energy density map versus doping ramp and mean value. (b) Maximum gain map versus doping ramp and mean value. The optimum region (dashed) is defined by an upper boundary: the  threshold iso-gain curve. Below this value, ASE triggered parasitic oscillations are expected to be severely limited, guaranteeing a satisfactory efficiency for the amplifier. The iso-energy density
  line defines the lower boundary. The Lucia low temperature amplifier operating point is marked with the blue circle (0, 1). The yellow circle is located at the lowest gain position along the
  energy density line.
threshold iso-gain curve. Below this value, ASE triggered parasitic oscillations are expected to be severely limited, guaranteeing a satisfactory efficiency for the amplifier. The iso-energy density line defines the lower boundary. The Lucia low temperature amplifier operating point is marked with the blue circle (0, 1). The yellow circle is located at the lowest gain position along the energy density line. Fig. 7. (a) Gain contrast  versus doping ramp and mean value. The unity contrast line defines the frontier of doping domains where the minimum gain becomes negative due to strong 1030 nm absorption (
 at.%). (b) Gain (bold curves, left scale) and
  concentration (dashed lines, right scale) distributions within three 1 cm thick crystals. The respective extreme doping values are given in the inset. The grayed-out bottom area defines the negative gain location.
versus doping ramp and mean value. The unity contrast line defines the frontier of doping domains where the minimum gain becomes negative due to strong 1030 nm absorption ( at.%). (b) Gain (bold curves, left scale) and concentration (dashed lines, right scale) distributions within three 1 cm thick crystals. The respective extreme doping values are given in the inset. The grayed-out bottom area defines the negative gain location.
|
Table 1. Absorption and emission cross sections at 300 and 160 K.
|
Table 2. Energetic improvement for the low temperature amplifier.


Set citation alerts for the article
Please enter your email address

© Copyright 2018-2021 | Chinese Laser Press. All Rights Reserved 沪ICP备15018463号-20