
J.-C. Chanteloup, M. Arzakantsyan, and S. Marrazzo, "Defining the optimal gradient doped Yb3+:YAG disk for room and low temperature diode pumped solid-state laser operations," High Power Laser Sci. Eng. 2, 04000e35 (2014)
- High Power Laser Science and Engineering
- Vol. 2, Issue 4, 04000e35 (2014)
Abstract
Keywords
1. Introduction
The elaboration and processing of yttrium aluminum garnet  (YAG) laser crystals with controlled spatial distribution of
  ions has been demonstrated with the horizontal direct crystallization (HDC) technique known as the Bagdasarov growth method[
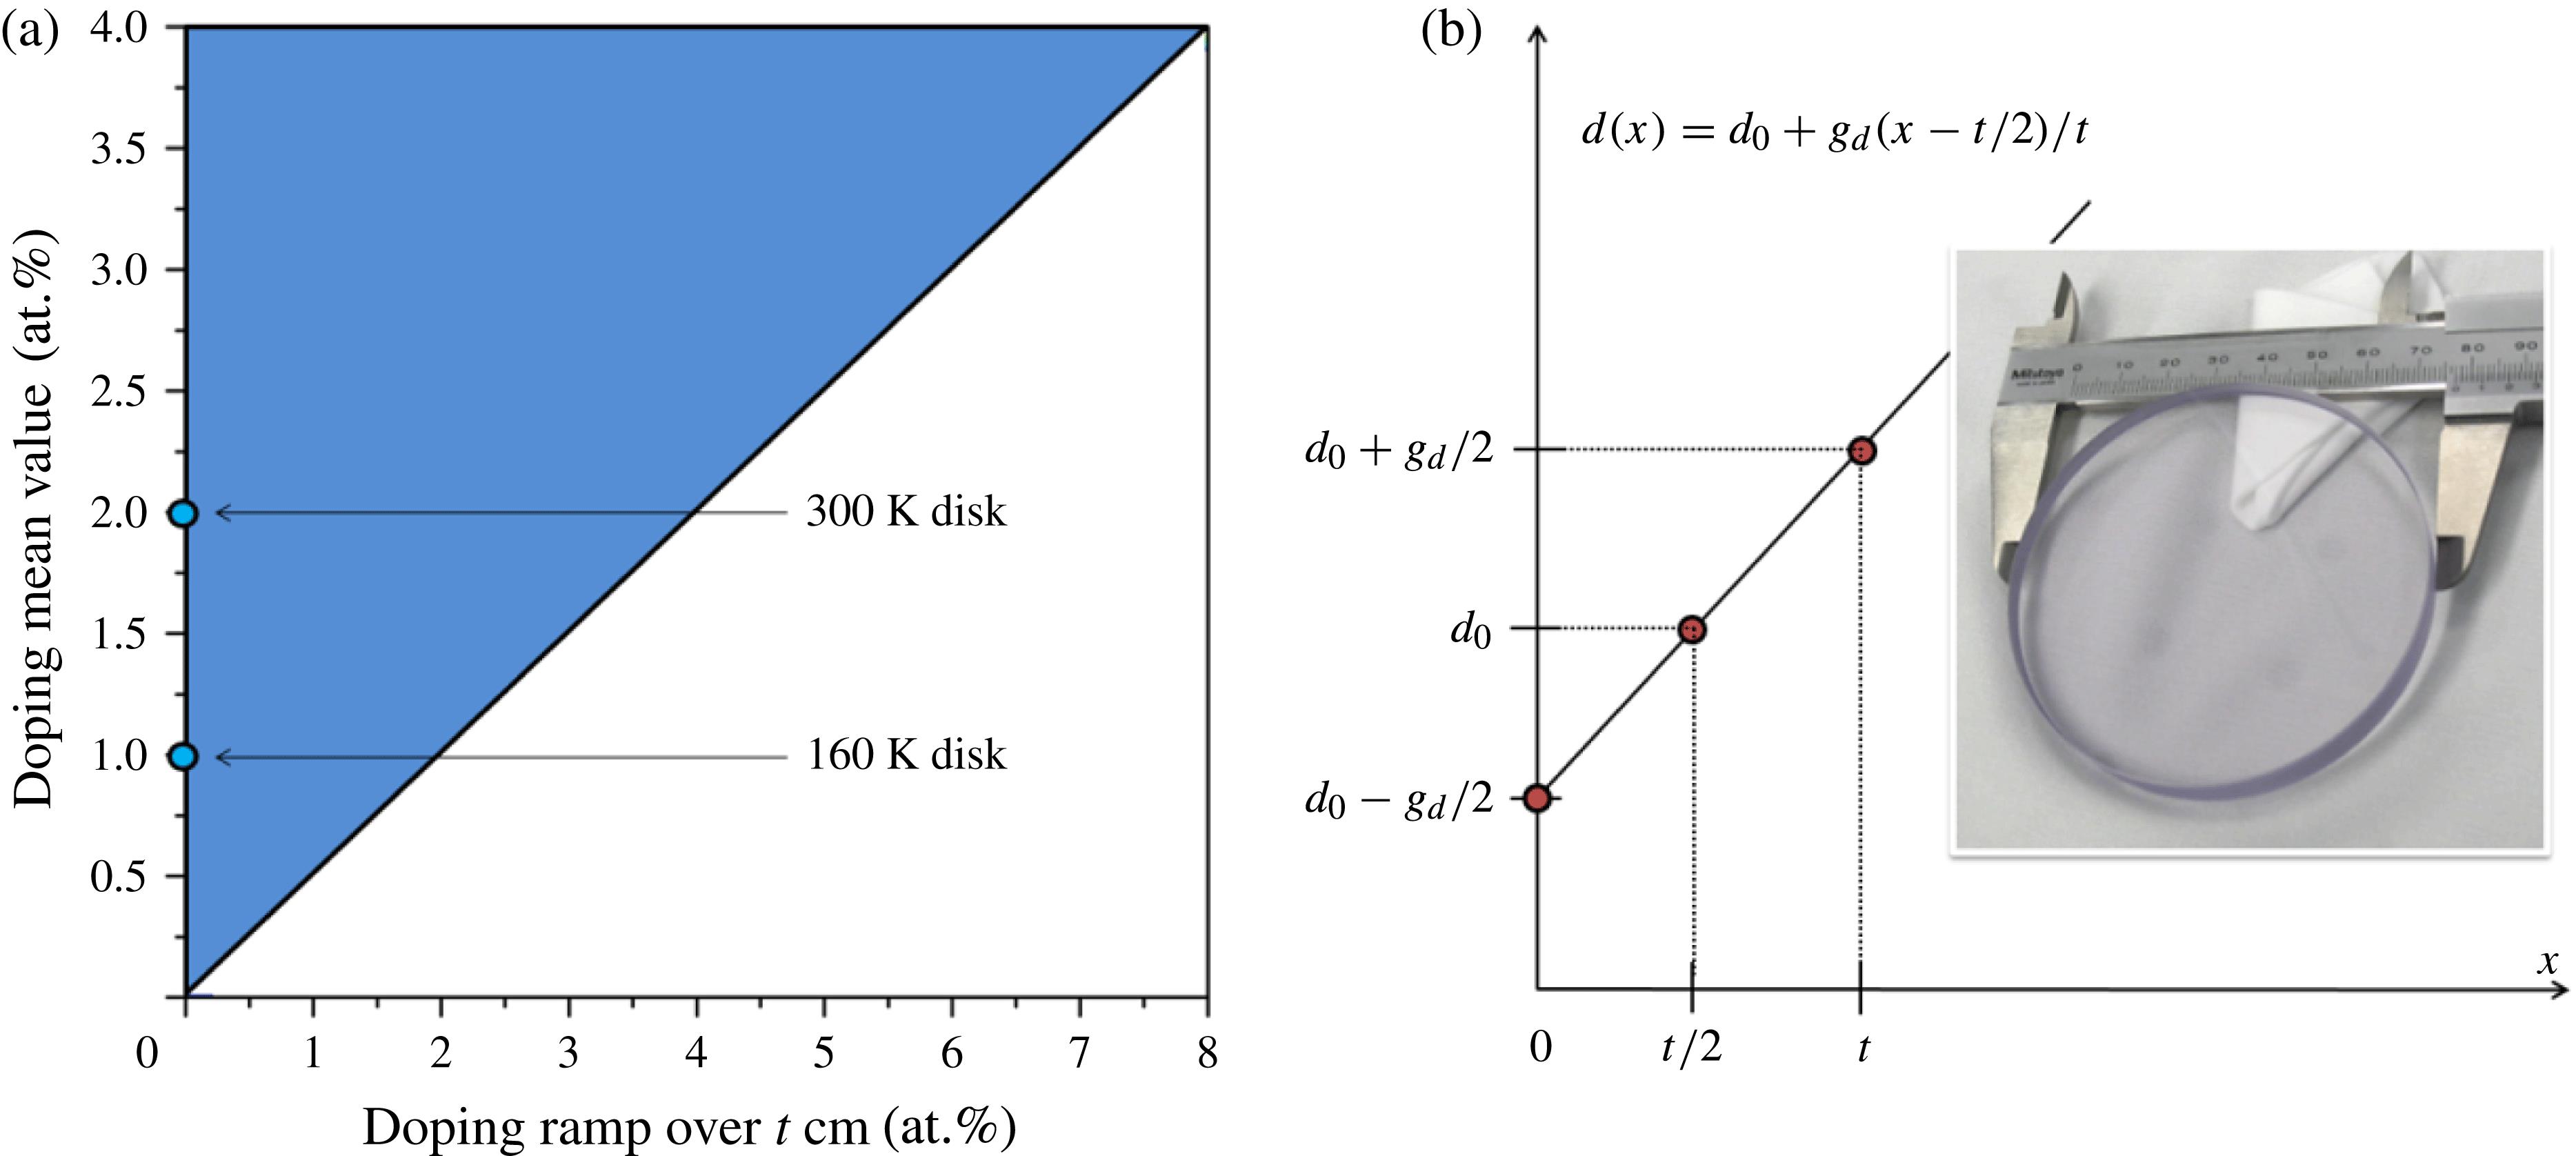
We detail here a methodology to define the optimum doping ion volume distribution required for two diode pumped Yb:YAG amplifiers. The proposed approach requires one first to define a convenient workspace to easily quantify the lasing ion distribution in an HDC engineered gain medium of thickness  (see Figure
  [at.%], the doping linear ramp, as the first relevant quantity (horizontal axis).
  is the actual gradient, expressed in at.%
  . The second quantity is the average doping level
  [at.%] (vertical axis), which corresponds to the doping level at half the thickness of the considered disk,
  . A disk is therefore defined in a two-dimensional [
 ] workspace limited by the blue triangle in Figure
We consider two experimental cases corresponding to the two power amplifiers of the Lucia laser project[
Sign up for High Power Laser Science and Engineering TOC. Get the latest issue of High Power Laser Science and Engineering delivered right to you!Sign up now
Section
The 300 K amplifier disk is 60 mm in diameter and 7 mm thick, homogeneously doped at 2 at.%, defining a working point  at.%,
at.%,  at.%) in our workspace. The optimum point
The 160 K amplifier disk is 77 mm in diameter and 10 mm thick, homogeneously doped at 1 at.%, defining a  at.%,
at.%,  at.%). The
2. Absorption cross sections
The Lucia DPSSL currently operates two active mirror amplifiers at 300 and 160 K. In both cases, the gain medium is a YAG disk whose thickness and doping level have been optimized to maximize the laser efficiency considering a homogeneous volume distribution of Yb ions. The Lucia cryogenic amplifier relies on a thin (sub-mm) layer of helium for heat extraction[
| Temperature | 300 (K) | 160 (K) |
|---|---|---|
| Absorption cross section at 940 nm |  |  |
| Absorption cross section at 1030 nm |  |  |
| Emission cross section at 1030 nm |  |  |
| Emission cross section at 940 nm |  |  |
Table 1. Absorption and emission cross sections at 300 and 160 K.
3. Optimum Yb:YAG disk for a 300 K amplifier
The Lucia laser chain room temperature operated amplifier has previously been detailed[ over an area limited to 30 mm in diameter in order to take advantage of the 1030 nm absorption to mitigate ASE parasitic oscillations (Figure 16 of Ref. [
 mm. Considering the well-known limit for the constraint
  , the maximum allowed value for the small signal gain is
  . Wherever in the gain medium the gain exceeds this threshold, one enters into a regime where parasitic oscillations will start to deplete the gain.
Let us consider the workspace defined in Section  and the average doping level
  . Extreme values of
  are set from 0 to 8 at.% along the disk thickness of 7 mm. This means that the maximum explored gradient reaches 11.4 at.%
  . Extreme values of
  are set from 0 to 4 at.%. The Lucia current room temperature operated crystal is then defined in this space by a
  at.%,
at.%,  at.%). Let us first consider how the stored energy density (
 ) is distributed in this workspace (Figure
  . The corresponding iso-energy density line is drawn on the map as well. It defines a boundary below which the Lucia room temperature energetic performance would not be satisfied. It is remarkable to observe that above this frontier, an increase in the average doping affects the energy density only very moderately, whereas below this line it decreases very rapidly. The
This map is obtained without considering ASE losses. In practice, increasing the doping mean value far above 2 at.% would actually not lead to a continuous increase of the stored energy density because at some point the gain medium would start seeing its gain being depleted by ASE related deleterious effects. We have defined such a threshold while introducing  . A maximum gain value map was then derived to identify the safe operation area within the workspace (Figure
  ,
,  ) point, the gain axial variation
  is first computed. In Figure
  , is then simply reported on the map.
On this map, the  threshold iso-gain curve (solid back) is reported together with the
  iso-energy density line, the first defining an upper boundary and the second the lower frontier of a small optimum region (dashes). The inset gives an enlarged view of the area of interest (AoI) within which this optimum region falls. The Lucia current
  whereas the
  ) is marked in yellow.
Obtaining an axial gain distribution as homogeneous as possible helps in staying below the parasitic oscillation threshold whatever the depth into the gain medium and reduces the gain medium internal stresses induced by the thermal load[
In order to identify the area of best homogeneity, it is convenient to study the gain contrast, defined as  . The map of Figure
  distribution. As a reference, the AoI rectangle is also displayed as well as the
  iso-energy density line and both the
4. Optimum Yb:YAG disk for a 160 K amplifier
The Lucia low temperature amplifier hosts a 10 mm thick, 1 at.% doped Yb:YAG disk. It is 77 mm wide but pumped over a  elliptical surface, leading to a
  similar to the previous 300 K case. At Lucia working point coordinates (0 at.%, 1 at.%), the stored energy density is
  . Figure
  ) map for the explored region. The iso-energy density
  line is shown on the map. It defines a boundary below which the Lucia low temperature energetic performance would not be satisfied. We observe here also that this boundary is set on the edge of an energy density plateau culminating at a
  energy density as shown by the 3.4, 3.42, and
  iso-energy density curves.
Like for the 300 K case, a maximum gain value map is derived to identify the ASE-compatible area (Figure  threshold iso-gain curve (solid back) is reported together with the
  iso-energy density line, the first one defining an upper boundary and the second one the lower frontier of the optimum region (dashes). Since the Lucia low temperature amplifier was designed to satisfy the
  criterion as closely as possible, the associated
  curve: its value is
  . With respect to ASE, a more optimum point marked in yellow can be identified where the maximum gain falls to
  . At the other extremity of the optimum region, it is possible to slightly improve the energy storage to reach
  if we accept an increased level of ASE losses and, more critically, to the extent of a four times stronger doping gradient and two times higher average doping level! Finally, Figure
  is extremely bad, of the order of 100%, a value that would cause severe issues in terms of heat load thermal management. The value of
  is 10% for the
At first sight, it can be surprising to observe that, above a 2.2 at.% average  concentration, we enter into a
  reaches a value above 150%: the green circle of (6 at.%, 3.5 at.%) coordinates. Such a 1 cm crystal would present a 0.5 at.% doped entrance face to the pumping beam while the cooled side would exhibit a 6.5 at.% concentration, as illustrated on the graph of Figure
As a reference, the 1 at.%  yellow
  , 3.5 at.%) crystal. For such a high average doping level (3.5 at.%), this crystal is too thick. Indeed, the last 3 mm of the crystal are actually absorbing (negative gain) the 1030 nm light. This negative gain area is grayed out on the graph. Having such a negative minimum value for the gain explains why the contrast
  (as defined) exceeds the 100% value.
Pump intensity ( ) ) | 5.5 | 6 | 6.5 | 7 | 8 | 9 |
Stored energy density ( ) ) | 3.29 | 3.76 | 4.06 | 4.34 | 4.78 | 4.9 |
Storing efficiency,  (%) (%) | 59.8 | 62.7 | 62.5 | 62.0 | 59.8 | 54.4 |
Doping mean value,  (at.%) (at.%) | 1.0 | 1.8 | 1.6 | 1.4 | 1.0 | 0.7 |
Doping gradient (at.%  ) ) | 0 | 3.0 | 2.4 | 2.0 | 1.1 | 0.3 |
Table 2. Energetic improvement for the low temperature amplifier.
5. Parametric study
Higher values of stored energies might be achieved by choosing the appropriate combination of pump power, doping mean value  and doping ramp
  . This obviously influences also the storage efficiency
  . Table
  ASE limitation was imposed and the crystal thickness was kept at 1 cm. By increasing the pump power, one can increase the stored energy density, while never exceeding a local gain above
  , by choosing the appropriate doping distribution. Increasing the pump power above
  does not significantly improve the stored energy density due to the imposed limitation (
 ). The stored energy efficiency reaches a 62.7% optimum for
  pump power and a crystal of 0.3–3.3 at.% linear doping distribution. The amount of stored energy can be significantly increased from 3.29 up to
  by increasing the pump power to
  while keeping the 59.8% efficiency of the constant doped case. The doping gradient necessary for this case is only
  at.%
at.%  , a value already achieved with HDC and easier to obtain than the 3 at.%
  of the previous case. It should be kept in mind that any pump power increase is related to major investment in laser diodes. The thickness of the crystal could also be reduced, but such optimization would only make sense in order to achieve better cooling efficiency. Considering that the current low temperature cooling system is highly effective[
6. Conclusion and outlook
A methodology to define the optimum doping ion volume distribution was derived in the context of the Lucia DPSSL room and low temperature active mirror amplifiers. After delimiting an optimum region whose boundaries are defined by minimum energy storage and maximum ASE-compatible gain considerations, the optimum point is selected considering the axial gain contrast. Minimizing this gain modulation will help in homogenizing the thermal load, therefore reducing the internal stresses and associated losses (like depolarization) the gain medium is submitted to Ref. [
This approach is valid for other DPSSL amplifier architectures like the DIPOLE[
References
[4] A. Lucianetti, D. Albach, J.-C. Chanteloup. Opt. Express, 19, 12766(2011).
[5] L. M. Frantz, J. S. Nodvik. J. Appl. Phys., 34, 2346(1963).
[9] D. Albach, T. Gonçalvès-Novo, J.-C. Chanteloup. Plasma Fusion Res., 8, 3405049(2013).
[11] M. Siebold, F. Roeser, M. Loeser, D. Albach, U. Schramm. Proc. SPIE, 8780, 878005(2013).


Set citation alerts for the article
Please enter your email address

© Copyright 2018-2021 | Chinese Laser Press. All Rights Reserved 沪ICP备15018463号-20