Abstract
Magnetic localized surface plasmon modes are supported on metallic spiral structures. Coupling mechanisms for these metamaterial resonators, which are the joint action of magnetic and electric coupling, are studied. Based on the strong coupling, spoof magnetic plasmon modes propagating in the backward direction are proposed along a chain of subwavelength resonators. The theoretical analysis, numerical simulations, and experiments are in good agreement. The proposed novel route for achieving negative-index waveguiding has potential applications in integrated devices and circuits.1. INTRODUCTION
Texturing closed surfaces was proposed to support spoof localized surface plasmons (LSPs) at the subwavelength scale [1]. This concept has attracted considerable interest because of its ability to emulate optical frequency LSPs at much lower frequencies. Recently, the prospect has been substantially extended with the demonstration of spoof LSP modes supported by ultrathin and flexible metal films. [2]. This metamaterial approach opens novel routes to bringing most of the advantages associated with conditional LSPs from microwave to far-infrared frequencies, such as transport [3,4], sensors [5], and wave control [6,7]. One of the interesting things is that a new concept of magnetic localized surface plasmons is supported on metallic spiral structures (MSSs) at a deep-subwavelength scale [8]. Furthermore, the near-field coupling of MSS resonators is studied. Zhang and colleagues studied the coupling mechanism in stacked MSSs theoretically and experimentally [9,10]. As mentioned in Ref. [11], the hybridization between adjacent MSSs that supports spoof LSP was investigated at microwave frequencies. In this case, the hybrid electric spoof plasmon modes can be manipulated to produce enormous field enhancement.
In negative-index materials, the wave propagates in the opposite direction between its phase velocity and group velocities, which is termed a backward electromagnetic (EM) wave [12]. It has attracted considerable interest in the past decade in the context of metamaterials [13,14] and plasmonic structures [15–19]. The backward wave is an important property of negative-index materials and has many application potentials, such as perfect lenses [20,21], hyperlenses [22,23], EM cloaking, advanced antenna design, and accelerator applications [24,25]. Backward waves have also been effectively realized in left-handed transmission lines [26,27] and many novel EM components or antenna concepts [28].
In this paper, we introduce a new design of plasmonic metamaterial to transport backward spoof magnetic plasmon modes by a coupling mechanism. First, we make an investigation on the coupling mechanism in two MSS dimers by theory, numerical calculations, and experiments. Second, we extend these MSS dimers to MSS chains by arranging multiple particles in a line. Theoretical analysis, simulation, and measurement are employed to verify that a one-dimensional chain of MSSs can support the propagation of spoof magnetic plasmon modes in a deep-subwavelength scale as expected. Third, we explore the anti-parallel phase and group velocities. We believe these results propose a flexible method to construct subwavelength backward wave waveguides, and they are expected to be helpful in the development of metamaterials and nanophotonic devices.
Sign up for Photonics Research TOC. Get the latest issue of Photonics Research delivered right to you!Sign up now
2. SPOOF MAGNETIC LOCALIZED SURFACE PLASMON RESONANCE
The inset of Fig. 1(a) presents the geometry of a single MSS. The MSS structure can be characterized by four spiral arms with width . The outer radius , the inner radius , and the spacing of neighboring arms . By using a standard printed circuit board fabrication, a 0.035 mm thick MSS is printed on a 0.5 mm thick F4b dielectric substrate, which has a relative permittivity with a loss tangent of 0.001. When introducing an external magnetic field perpendicular to the substrate, the excited magnetic field is recorded by a probe placed 1 mm above the center of the particle. Numerical simulations are performed based on a commercial software package CST Microwave Studio. The result is plotted in Fig. 1(a) as a function of frequency. At about 1.872 GHz, the magnetic field reaches the peak, indicating that a large magnetic resonance is excited in the MSS. The current is plotted in Fig. 1(b). It shows a circulating current that forms magnetic resonance along the axis. The magnetic field at the plane is shown in Fig. 1(c), in which the H-field lines circulate around the disk, as in a magnetic dipole. The electric field at the plane is shown in Fig. 1(d). Similar results have been reported by previous works [8,11], and the mode was termed magnetic spoof LSP resonance. In fact, there exist electric modes in the MSS at lower frequencies. In this work, we only investigate the coupling of the magnetic resonant modes in the MSSs.
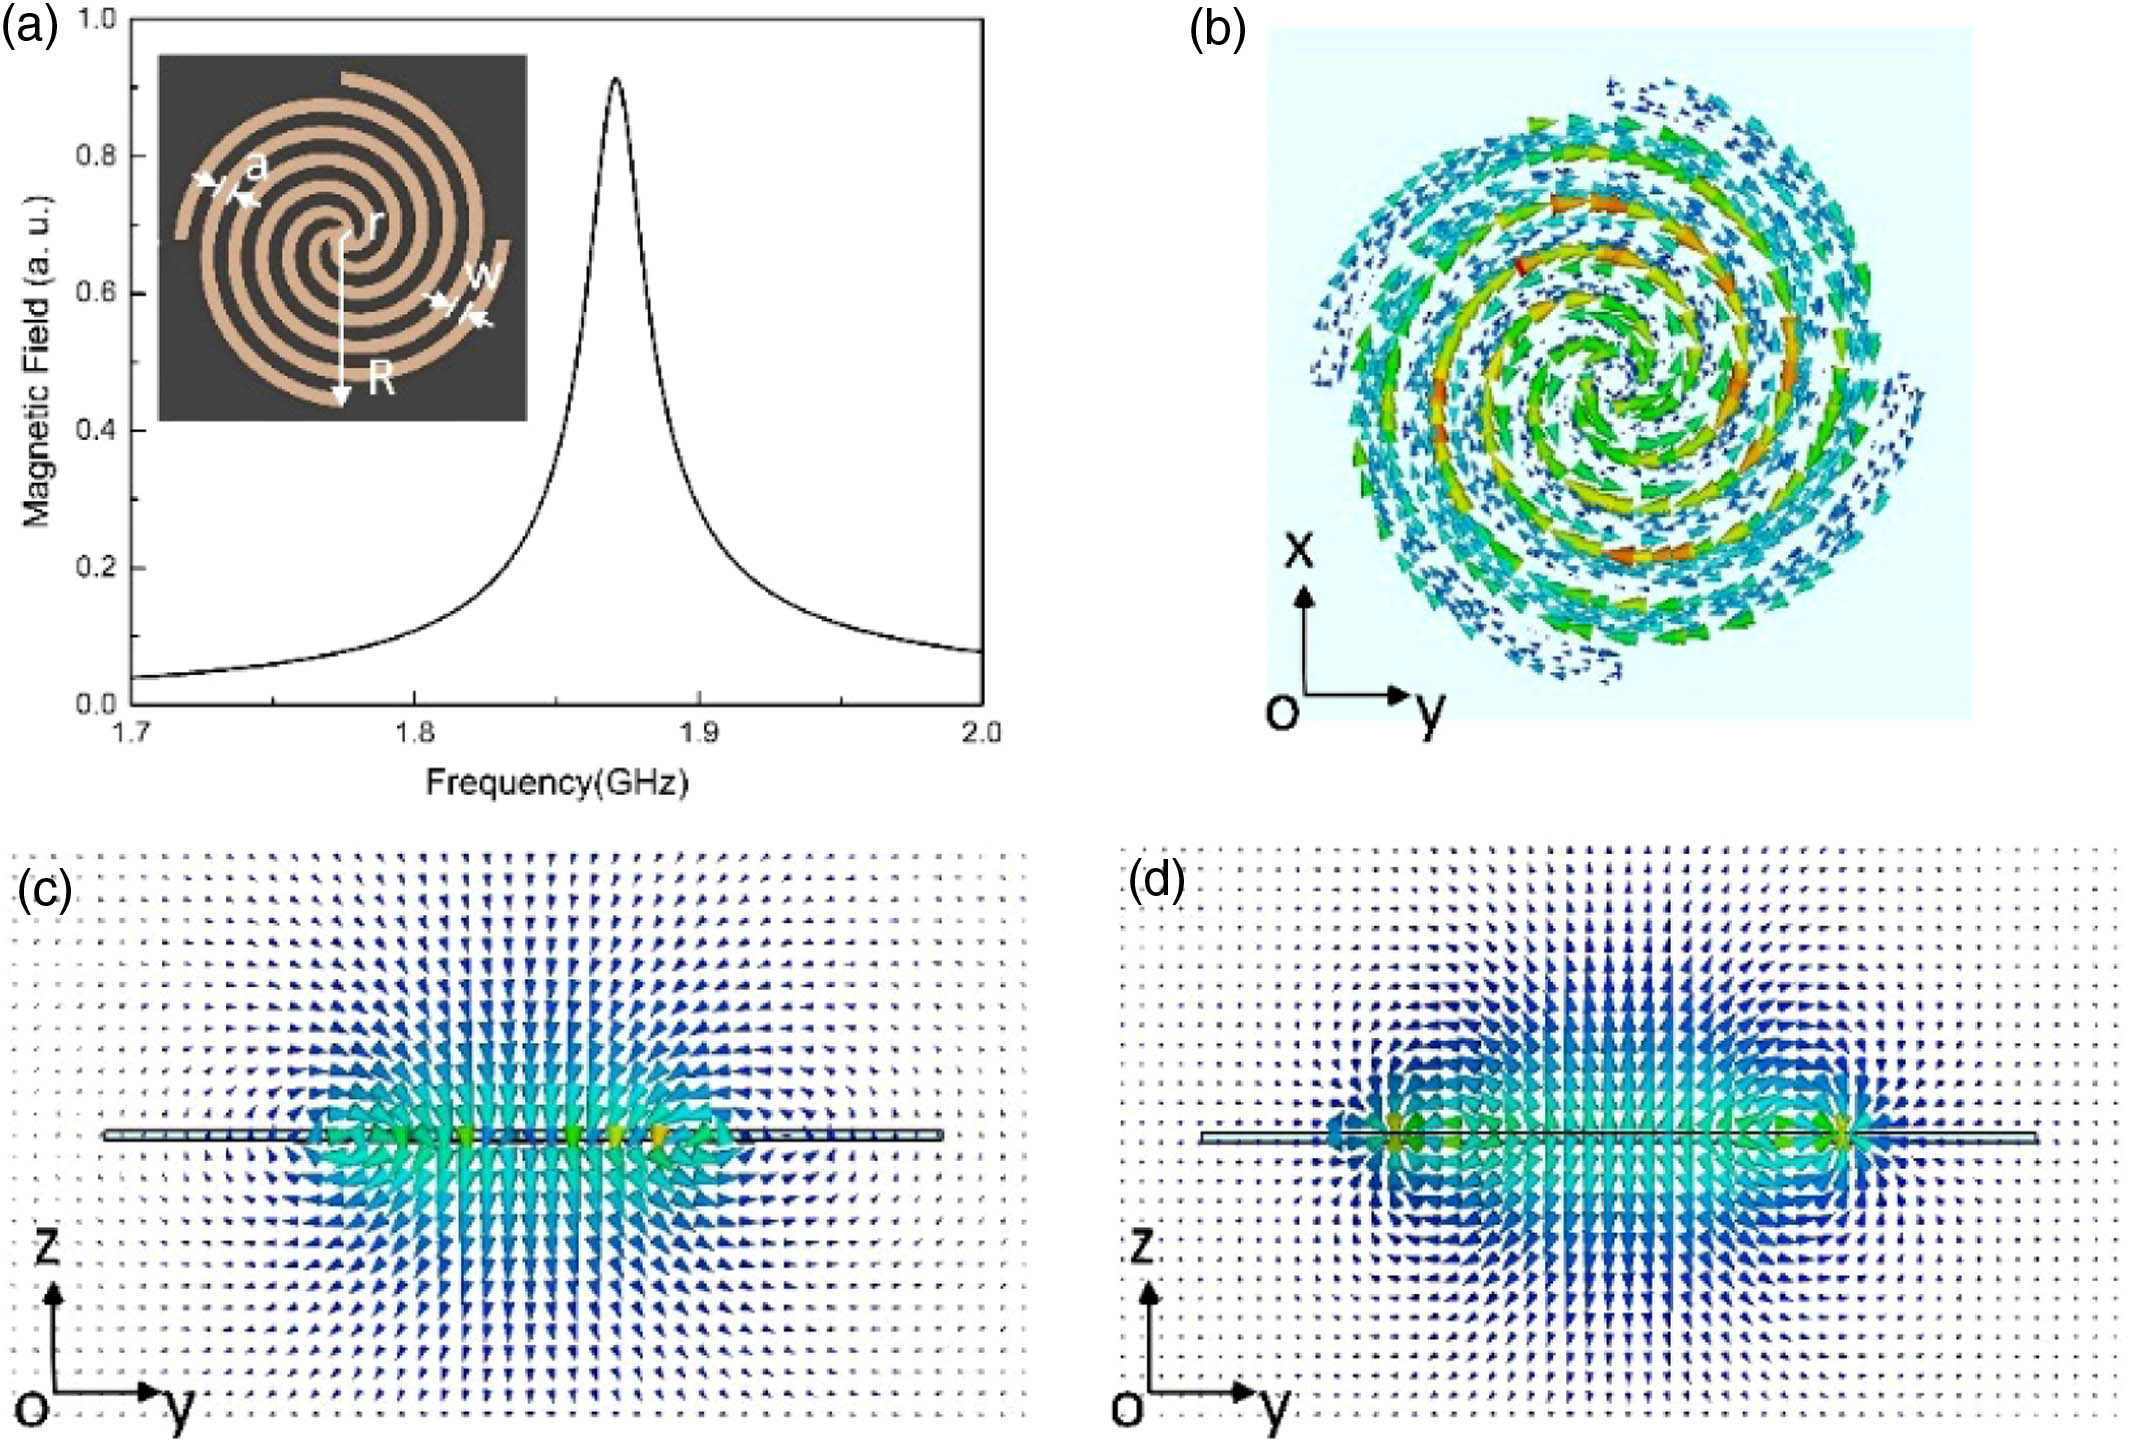
Figure 1.(a) Magnetic field amplitude intensity detected at the center of the resonators; the inset is a schematic illustration of the metallic spiral structure. (b) Current distribution at , (c) magnetic field at , (d) electric field at .
3. TRANSPORT OF SPOOF MAGNETIC PLASMON MODES
Before discussing the proposed waveguiding structures, we first study an MSS dimer with separation in Fig. 2(a). An excitation source is placed beside these MSS dimer metamaterials, and a probe is placed 1 mm above the center of the left particle to detect the distribution of near electric field . Note that the sources are dipole in the simulation and monopole in the experiment. Although the excitation methods are different, the excited modes are the same. The simulated near-field response spectra of the dimer structure are shown in Fig. 2(c). For the dimer system (red line), there are apparently two observable resonances ( and ), which are split from the resonance of the single MSS due to the coupling effect. To verify the above phenomenon, a prototype of the single MSS particle and dimer is fabricated and measured as shown in Fig. 2(b). The near-field performances of the proposed structures are measured by the Agilent vector network analyzer. Figure 2(d) gives the measured near-field response spectra results, in which good agreements are observed between the simulations and measurements. There are still some deviations between the simulated and measured results. Actually, the numerical simulation results are obtained under ideal conditions. Some machining errors and mechanical errors are also not considered in the simulation.

Figure 2.Simulation and measurement setups of the MSS dimers are shown in (a) and (b), respectively. The near-field response spectra for a single MSS (black line) and MSS dimer (red line) in (c) simulations and (d) measurements. The insets correspond to the electric field maps for the split higher and lower modes, respectively.
To understand these spectral characteristics, the simulated instantaneous electric field in the plane 1 mm above the structure at the relevant resonances is shown in the inset of Fig. 2(c). Apparently, two magnetic dipoles are excited and coupled transversely. Comparing the two modes, the phase difference between the left and right MSSs in the dimer configuration is at the lower resonance frequency () and at the higher resonance frequency (). This phenomenon can be interpreted as plasmon hybridization [29–31] between the two MSSs due to their close proximity [11]. Furthermore, the experimental measurement of field distributions is carried out to demonstrate the bonding and antibonding modes of the MSS dimers. The experimental configuration is similar to the simulations above. As shown in Fig. 2(d), the measured fields agree with the numerical results very well.
To better understand the underlying physics of the couplings, we develop a theoretical analysis based on Lagrangian formalism. We start from a single MSS and then expand it to coupled MSS dimer systems. The MSS can be regarded as an equivalent circuit. It consists of four spiral arms with inductance and gaps between neighboring spiral arms with capacitance . The resonance frequency of a single circuit is . If we define the charge accumulated in the MSS as , the Lagrangian of an MSS can be written as , in which refers to kinetic energy from the inductances and is the electrostatic energy stored in the capacitors. Here, we can transfer the form of as . Therefore, the Lagrangian of the MSS dimer systems is a combination of two individual MSSs with the additional electric and magnetic coupling terms as follows: where is the total oscillation charge in the th MSS, the interaction term is due to magneto-inductive coupling, and represents the electro-inductive interactions between the two MSSs.
If we define that the Ohmic dissipation is neglected in the dimer, the Euler–Lagrange equation can be written as Substituting Eq. (1) into Eq. (2), we get the coupled equation Equation (3) yields solutions in the form of harmonic oscillations . By solving Eq. (3), the eigen-frequencies of the MSS dimer systems can be obtained as where is the resonance frequency of the single MSS. Here, and are the normalized coefficients of the magnetic and electric couplings for the MSS dimer, respectively. Since we have already obtained the eigen-frequencies of the two coupled cases from the above simulated analysis, the corresponding coefficients are estimated to be and . It is evident that the electric coupling strength is larger than the magnetic coupling strength, which means electric interaction dominates in the MSS dimer system.
Furthermore, we extend this MSS dimer to a chain of MSS resonators. Such chains can be utilized as a waveguide, similar to previous coupled resonator optical waveguides (CROWs) [32,33]. The diameter of the MSS is about 25 mm, which is far smaller than the operating wavelength (). Because of the subwavelength size and confinement in the transverse dimension, it can be regarded as a subwavelength waveguide based on the coupling between magnetic resonances. The magnetic resonance and interaction model described above can also be employed to investigate an infinite chain of MSSs. Indeed, if we regard MSS resonators as an ideal magnetic dipoles model, which constitutes a one-dimensional array and assumes that only the nearest neighbor units can interact with each other, the Lagrangian of the chain system can be written as follows: Substituting Eq. (5) into the Euler–Lagrangian equations, we can get the following equation for the MSSs chains: The general solution of Eq. (6) corresponds to a travelling wave , where and are the angular frequency and wave vector, respectively, and is the period of the MSS chains. By substituting into Eq. (6), the relationships for dispersion can be solved as follows: where is the resonance frequency of the individual MSS. Pictures of the dispersion property with period (black line) are shown in Fig. 3.
Figure 3.Dispersion diagrams of infinite chains of metallic spiral structures based on Lagrangian analytical mode (black line), coupled mode theory (red symbols), and numerical simulation (square symbols). The blue dash line is the dispersion of the light in free space.
To demonstrate the validity of the predictions in another way, coupled mode theory is also applied. We describe the coupled MSS dimer system as follows: where and represent resonance fields in each MSS resonator, and is the magnetic resonance frequency in a single MSS. By solving the eigen-value problem in Eq. (7), the normalized orthogonal eigen-solutions of are and , corresponding to the antiparallel magnetic dipole moments mode and the parallel magnetic dipole moments, respectively. We can solve the corresponding eigen-frequencies as and . After substituting , , and , we can obtain the coupling factor as . Here the MSSs chain is similar to previous CROWs [3,32]. Therefore, the intrinsic dispersion relation can be obtained as , where is the wave vector and is the period of the waveguide. Apparently, the magnitude of determines the coupling strength, and the sign affects the relation between the wavevector and frequencies. We plot the dispersion curves of an infinite chain of MSSs with symbols in Fig. 3. As expected, the dispersion curve is overlapping with the line from the Lagrangian analytical mode, illustrating that our analysis is efficient.
To further prove the validity of our theory, we use the finite element method (Software HFSS) to perform numerical simulations. In the simulation, the perfectly matched layer (PML) boundaries are defined in the direction and direction. Master and slave boundaries are then applied in the direction. The phase difference is defined and is used for sweeping. By eigen-mode analysis, the dispersion relation is obtained, as shown in Fig. 3. We found that the simulated result has a similar dispersion with two theoretical models. The operating frequency band of the simulation has a 0.02 GHz (about 1% of resonance frequency) shift. This is because our theoretical calculations are based on CST’s results. The two softwares involve two different computational techniques, which are the finite integration technique (FIT) and finite element method (FEM). Beyond that, the theory analysis only calculated the coupling between nearest neighbor units. However, the simulation considered the effects from all particles. As a result, we found that analytical and numerical estimated dispersion is divided into two parts by the light line. The part below the light line indicates that the infinite MSS chain has transmission band and confinement capacity.
Inspired by the above results, we constructed a chain that consists of 40 MSS particles. Numerical simulations are still performed using the commercial solver (CST). A dipole beside the left side of the chain was defined as the excitation source so the magnetic field can excite the magnetic resonance in the MSS chain. The magnetic fields in the planes and are plotted in Figs. 4(b) and 4(c) at 1.86 GHz. It is shown that the magnetic resonances were excited in the MSSs in the direction perpendicular to the chain, which forms coupled magnetic resonance modes and propagation. Unlike the surface plasmon resonances in metal nanoparticles and spoof surface plasmons in structured metamaterials, this spoof plasmonic behavior is a magnetic induction method. We call such coupling of external electromagnetic waves with a strong magnetic response “magnetic plasmons” (MPs)
Figure 4.(a) Geometry of MSS chain. The red dash line indicates the observed cross section. The blue line indicates the observation line. The magnetic fields in the plane and plane are presented in (b) and (c), respectively.
From the dispersion relations in Fig. 3, we observe an increase in deviation of the dispersion curve with respect to the light line as frequency decreases, which implies a stronger field confinement. To show the sub-wavelength property, we also investigate the magnetic field amplitudes along the axis at the center of the seventh MSS at 1.84, 1.86, and 1.88 GHz. The magnetic fields clearly decay exponentially along the direction. The field is confined in the space ranging from to 25 mm, which is smaller than the wavelength in free space (160 nm). The strong confinement illustrates the typical features of magnetic plasmon modes. Figure 5(b) shows the field distributions of 1.84 and 1.88 GHz in the cross section perpendicular to the axis [red dash line in Fig. 4(a)]. The local field is confined in a small region. Moreover, as the frequency decreases from 1.88 to 1.84 GHz, confinement tightens and field enhancement increases, which is consistent with the dispersion relation.
Figure 5.(a) Magnetic field distributions along the axis; (b) magnetic field distributions on the cross sections of the MSS chain at 1.84 and 1.88 GHz.
Figure 6 depicts the magnetic field distributions along an observation line [blue line in Fig. 4(a), about long] lying 1 mm above along the MSS chain for several specific frequencies. The field intensity and propagating length are consistent with previous estimations of dispersion. At 1.88 GHz, the propagating length is short because the dispersion is close to the light, resulting in weak confinement and radiation loss. As the frequency decreases from 1.88 to 1.86 GHz, the deviation of the dispersion with the light increases. Then the field confinement increases and results in a longer transmission distance and higher intensity. At 1.86 GHz, we get the best performance in transmission. The propagation efficiency was as high as 90% when traveling 400 mm and about 50% in the range of 1000 mm. However, when the frequency reaches 1.84 GHz, tighter confinement generates more loss and brings bad effects to the transmission. At 1.82 GHz, there is no energy transportation in the chain because it is out of the transmission band.
Figure 6.Magnetic field distributions along the MSS chain at different frequencies.
To demonstrate the transport of the proposed spoof magnetic plasmon modes in subwavelength scales, we constructed a chain that consists of 10 MSS particles to measure the transmission spectra, as shown in Fig. 7. We found a transmission band from 1.84 to 1.88 GHz, which is consistent with the magnetic distributions in Fig. 6 and the dispersion in Fig. 3. We also simulated the transmission spectra (red line) of this MSS chain, whose frequency range matches well with the measured results. Figure 7(c) presents the simulated amplitude of electric field in the plane 1 mm above the structure. The pattern shows that magnetic dipole modes propagate along the MSS chain. Because of the mismatching at the end of the waveguide, the standing wave leads to some fluctuations in field distribution, which also appear in the transmission line in Fig. 6. We also measured and illustrated the field distribution along this chain in Fig. 7(d). The experimental results match well with the simulation, whose mode profiles do not have obvious change during energy transportation. Note that there is some discrepancy in the magnitudes of simulation and measurement results. This is because in the measurement setup, the parameters (size, material, volume, etc.) of the probe we used may vary from the ideal probe in the simulation. Besides, fixing the probe exactly at 1 mm above the surface of the prototype is very difficult in the experiment, a factor that also affects the magnitudes of the measurement results. All the above factors will cause variance of the amplitude but will not affect the profiles of the transport magnetic modes, as we can see in the figures.
Figure 7.(a) Simulation and experimental setup, (b) simulated and measured transmission spectra for the metamaterial resonator waveguides that consist of 10 MSSs, (c) simulated and (d) experimental amplitude of electric field above the waveguide.
The parametric study is very important for understanding and application of this waveguide. The effect of geometric parameters of the discrete MSS is contained in the simulation process [8], so we focus on the separation between MSSs. The effects of the gap on the resonant frequencies of the MSS dimers are shown in Fig. 8(a). When the gap size is gradually increased from 0.5 to 10 mm, the splitting of the bonding and antibonding modes decreases as the mutual coupling decreases. The increase of the separation not only leads to the approach of all the resonance peaks as expected, but also results in the intensity reduction of the resonance modes. Figure 8(b) explores the dependence on of the resonant frequency of the MSS dimers. Figure 8(c) depicts the dispersions for the MSS chains with different gaps, which are solved by analytical models. The direct comparison among the four lines indicates that the MSS chain has a wider transmission bandwidth as the gap decreases. As anticipated, the comparison of transmission in Fig. 8(d) evidences that the bandwidth with is extended to triple the width with . In addition, the propagating intensity increases to more than 4 times, because a bigger wave number with in such frequency bands leads to tighter confinement and more loss.
Figure 8.(a) Simulation of transmission spectra for adjacent MSSs with varying gap size from 10 to 0.5 mm. (b) Resonance frequency of two modes as a function of gap size. (c) Dispersion relation with different gap sizes. (d) Transmissions of MSS chains with different gap sizes.
4. BACKWARD PROPAGATION OF SPOOF MAGNETIC PLASMON MODES
Besides energy transportation, it is apparent that the dispersion of the magnetic plasmons in the MSS chains shows anti-parallel phase and group velocities, which means a backward wave in a negative-index waveguide. To demonstrate our predictions, Fig. 9 presents the simulated instantaneous magnetic field in the plane 1 mm above the chain, in which the red and blue colors indicate positive and negative values, respectively. We found that the phase difference between two MSS disks () is at 1.84 GHz, at 1.85 GHz, and at 1.86 GHz in simulations. This is to say that the wave vector decreases as the frequency increases, indicating a backward wave. The backward spoof magnetic plasmon wave supported in the MSS chain at 1.86 GHz is also demonstrated by the simulated movie (see Visualization 1). This kind of subwavelength negative-index waveguide may be used efficiently in microwave applications, such as a new type of forward wave directional coupler [19,34], leaky-wave antennas with beam scanning capability [35], backward phase-matching [36], and power dividers. In addition, the MSS chain might be extended to novel 2D (or even 3D), a real negative-index material, with their full set of extraordinary properties, such as reversal of Snell’s law, Doppler effect, and Cerenkov radiation.
Figure 9.Simulated vertical magnetic-field distributions of the waves on the MSS chain.
5. SUMMARY
In conclusion, we have proposed and studied subwavelength MSS chains, which support spoof magnetic plasmon transmission. The numerical simulations, theoretical analysis, and the measurements demonstrate that the surface wave can be confined in a subwavelength scale. Moreover, backward waves have been observed. Although all our work was carried out in the microwave frequency band, the proposed structures and results can be extended to higher frequencies. We believe that such subwavelength spoof magnetic plasmon waveguides have very promising applications in subwavelength devices and systems.
References
[1] A. Pors, E. Moreno, L. Martin-Moreno, J. B. Pendry, F. J. Garcia-Vidal. Localized spoof plasmons arise while texturing closed surfaces. Phys. Rev. Lett., 108, 223905(2012).
[2] X. Shen, T. J. Cui. Ultrathin plasmonic metamaterial for spoof localized surface plasmons. Laser Photon. Rev., 8, 137-145(2014).
[3] F. Gao, Z. Gao, Y. Zhang, X. Shi, Z. Yang, B. Zhang. Vertical transport of subwavelength localized surface electromagnetic modes. Laser Photon. Rev., 9, 571-576(2015).
[4] Z. Gao, F. Gao, Y. Zhang, H. Xu, Y. Luo, B. Zhang. Forward/backward switching of plasmonic wave propagation using sign-reversal coupling. Adv. Mater., 29, 1700018(2017).
[5] J. Cai, Y. J. Zhou, Y. Zhang, Q. Y. Li. Gain-assisted ultra-high-Q spoof plasmonic resonator for the sensing of polar liquids. Opt. Express, 26, 25460-25470(2018).
[6] Y. J. Zhou, C. Zhang, L. Yang, Q. X. Xiao. Electronically controllable spoof localized surface plasmons. J. Phys. D, 50, 425102(2017).
[7] Y. J. Zhou, C. Zhang, L. Yang, Q. X. Xiao. Electronically switchable and tunable bandpass filters based on spoof localized surface plasmons. J. Opt. Soc. Am. B, 34, D9-D12(2017).
[8] P. A. Huidobro, X. Shen, J. Cuerda, E. Moreno, L. Martin-Moreno, F. J. Garcia-Vidal, T. J. Cui, J. B. Pendry. Magnetic localized surface plasmons. Phys. Rev. X, 4, 021003(2014).
[9] Z. Gao, F. Gao, Y. Zhang, B. Zhang. Deep-subwavelength magnetic-coupling-dominant interaction among magnetic localized surface plasmons. Phys. Rev. B, 93, 195410(2016).
[10] F. Gao, Z. Gao, Y. Luo, B. Zhang. Invisibility dips of near-field energy transport in a spoof plasmonic metadimer. Adv. Funct. Mater., 26, 8307-8312(2016).
[11] J. Zhang, Z. Liao, Y. Luo, X. Shen, S. A. Maier, T. J. Cui. Spoof plasmon hybridization. Laser Photon. Rev., 11, 1600191(2017).
[12] S. Ramo, J. R. Whinnery, T. Van Duzer. Fields and Waves in Communication Electronics(2008).
[13] V. G. Veselago. The electrodynamics of substances with simultaneously negative values of ε and μ. Sov. Phys. Usp., 10, 509-514(1968).
[14] R. A. Shelby, D. R. Smith, S. Schultz. Experimental verification of a negative index of refraction. Science, 292, 77-79(2001).
[15] H. Shin, S. Fan. All-angle negative refraction for surface plasmon waves using a metal-dielectric-metal structure. Phys. Rev. Lett., 96, 073907(2006).
[16] H. J. Lezec, J. A. Dionne, H. A. Atwater. Negative refraction at visible frequencies. Science, 316, 430-432(2007).
[17] E. Verhagen, R. de Waele, L. Kuipers, A. Polman. Three-dimensional negative index of refraction at optical frequencies by coupling plasmonic waveguides. Phys. Rev. Lett., 105, 223901(2010).
[18] R. Quesada, D. Martín-Cano, F. J. García-Vidal, J. Bravo-Abad. Deep-subwavelength negative-index waveguiding enabled by coupled conformal surface plasmons. Opt. Lett., 39, 2990-2993(2014).
[19] X. Y. Liu, Y. J. Feng, B. Zhu, J. M. Zhao, T. Jiang. Backward spoof surface wave in plasmonic metamaterial of ultrathin metallic structure. Sci. Rep., 6, 20448(2016).
[20] J. B. Pendry. Negative refraction makes a perfect lens. Phys. Rev. Lett., 85, 3966-3969(2000).
[21] N. Fang, H. Lee, C. Sun, X. Zhang. Sub-diffraction-limited optical imaging with a silver superlens. Science, 308, 534-537(2005).
[22] Z. Liu, H. Lee, Y. Xiong, C. Sun, X. Zhang. Far-field optical hyperlens magnifying sub-diffraction-limited objects. Science, 315, 1686(2007).
[23] I. I. Smolyaninov, Y.-J. Hung, C. C. Davis. Magnifying superlens in the visible frequency range. Science, 315, 1699-1701(2007).
[24] R. Marqués, F. Martín, M. Sorolla. Metamaterials with Negative Parameters: Theory, Design, and Microwave Applications(2011).
[25] L. Solymar, E. Shamonina. Waves in Metamaterials(2009).
[26] C. Caloz, T. Itoh. Transmission line approach of left-handed (LH) materials and microstrip implementation of an artificial LH transmission line. IEEE Trans. Anntenas Propag., 52, 1159-1166(2004).
[27] G. V. Eleftheriades, O. Siddiqui, A. K. Iyer. Transmission line models for negative refractive index media and associated implementations without excess resonators. IEEE Microw. Wireless Compon. Lett., 13, 51-53(2003).
[28] C. Caloz, T. Itoh. Electromagnetic Metamaterials: Transmission Line Theory and Microwave Applications(2005).
[29] E. Prodan, C. Radloff, N. J. Halas, P. Nordlander. A hybridization model for the plasmon response of complex nanostructures. Science, 302, 419-422(2003).
[30] H. Wang, D. W. Brandl, F. Le, P. Nordlander, N. J. Halas. Nanorice: a hybrid plasmonic nanostructure. Nano Lett., 6, 827-832(2006).
[31] P. Nordlander, C. Oubre, E. Prodan, K. Li, M. I. Stockman. Plasmon hybridization in nanoparticle dimers. Nano Lett., 4, 899-903(2004).
[32] A. Yariv, Y. Xu, R. K. Lee, A. Scherer. Coupled-resonator optical waveguide: a proposal and analysis. Opt. Lett., 24, 711-713(1999).
[33] H. Liu, D. A. Genov, D. M. Wu, Y. M. Liu, J. M. Steele, C. Sun, S. N. Zhu, X. Zhang. Magnetic plasmon propagation along a chain of connected subwavelength resonators at infrared frequencies. Phys. Rev. Lett., 97, 243902(2006).
[34] L. Liu, C. Caloz, C. Chang, T. Itoh. Forward coupling phenomena between artificial left-handed transmission lines. J. Appl. Phys., 92, 5560-5565(2002).
[35] Y. Weitsch, T. F. Eibert. Analysis and design of a composite left-/right-handed leaky wave antenna based on the H10 rectangular waveguide mode. Adv. Radio Sci., 6, 49-54(2008).
[36] S. Lan, L. Kang, D. Schoen, S. Podrigues, Y. Cui, M. Brongersma, W. Cai. Backward phase-matching for nonlinear optical generation in negative-index materials. Nat. Mater., 14, 807-811(2015).


